Counter-Trend Rally underway
We formed a very strong "Hammer" on the major index candlesticks on Friday. And tonight we're seeing Japan up 3% on word they are going to intervene to keep the Yen from appreciating.
But it's evident that the Nikkei's move tonight is bringing it smack dab into formidable resistance:
Nikkei chart
We can see that previous rallies have stalled at the 60 day MA, which is currently about 9500 for the Nikkei. So it will require confirmation tomorrow to see if the rally is sustainable.
Also, intervening against a continuing rise in the Yen means that Japan will have to buy US Dollars. And a strong US dollar may have a negative impact on Big Cap US stocks. But from the futures we're seeing, it's probably the US markets will also rally. However, I believe that rally will be unsustainable.
To see how interconnected the global markets are (especially the Currency markets), it's wise to review what some folks, who are much smarter than I, are saying.
Kyle bass made a fortune predicting the sub-prime mortgage meltdown and positioning himself to take advantage of it. His "street cred" is unimpeachable and he presents his views in clear, concise, and impeccably logical manner.
Deep Thoughts: Kyle Bass' take on Japan and the world.
Additional comments on Bass' views.
Interesting CNBC interview with Kyle Bass (starts 50 seconds into the clip).
Video link to CNBC interview
S&P 500 Chart possibilities
When Kyle Bass says he sees no reason to be in US equities, I think wise investors have to take note. And when he says he sees global GDP declining to -4%, that had better wake some people up.
But in between there will be these kinds of counter-trend rallies and the nimble can still take advantage of them for profit, while long-term retail investors can use them to sell into.
Scrutinizer
Sunday, August 29, 2010
Wednesday, August 25, 2010
Counter-trend Rally possible, but how far will it take the markets?
Every bear market move to the downside has a bear market rally. Some opine that the 83% upside since the March, 2009 low had been nothing but a bear market counter-trend rally and now the original downtrend is continuing. I tend to agree with this opinion.
So it's not a surprise that we might get a minor counter-trend rally after the recent declines. But it's going to need to be more powerful to reverse the triple decline of the major moving averages.
As we can see, there's a possibility of the S&P 500 moving back up to 1080 before it comes into maximum resistance at the 20, 50 and 200 Day MA. But that last move downward left a bunch of people who had been buying the S&P for 3 weeks and were stuck in their positions after that one day plummet. Now they are hoping for a rally to bail them out, so there's expectation of major selling at the 1060 range.
S&P 500 Daily
The Russell 2000 is also coming into a similar band of resistance. It's also lined up nicely with it's downward channel, so if it manages to move higher tomorrow, it will break that down channel and rally up to 620.
Russell 2000 daily
Ron at Chart Pattern Trader has some good comments on using Moving Averages, especially when they are all in alignment in the same direction.
MA alignments
Now.. what's amazing is that we had lousy data today, but the market fell, then rallied to close positive. Some are taking that as a sign of selling fatigue and that's a distinct possibility. It could also be that a short squeeze was forced by jacking the futures, in order to give the longs a final chance to distribute at higher prices before the final plunge to lower lows (breaking the neckline of the Head & Shoulders formation that I've been discussing and which seems to be gaining acceptance by market technicians.
Tomorrow and Friday will be telling indications as we get the jobs report and on Friday, revised GDP. If jobs data is better than last week's 500K new unemployment filings, it might provide a short-term impetus for continuing the rally. Obviously many are hoping that last week was an aberration caused by Census workers being laid off. If tomorrow proves otherwise, it could create that impetus that takes us below the neckline.
What I'm wondering is whether these extended unemployment benefits which were passed will require folks to re-apply, therefore adding to unemployment claims. I believe that's the case and that could drive unemployment numbers up substantially as folks who had fallen off the UE rolls, reenter and get counted along with the newly unemployed.
In sum, it's about jobs, jobs, jobs.. which equal consumer demand, which impacts economic performance and housing. And it's about preserving job skills, which decline during long periods of playing Xbox and thumb twiddling.
And along those lines, here's something I read that I feel justifies being re-posted here:
Uncle Scam
Anyone reading that has to be amazed that we have much economic and jobs growth at all.
Best of luck through the remainder of this week!!
Scrutinizer
Tuesday, August 24, 2010
Market telling us: "May You Catch A Thousand Falling Knives"
I really hate to have such a negative attitude towards the market. However, (apparently) like so many other investors, the STILL UNEXPLAINED "Flash Crash convinced me that this market was hopelessly rigged by a Financial equivalent of "Skynet" (ala, "Terminator"), with it's High Frequency Trading "black box" computers, and those financial WMDs known as Credit Default Swaps, that it just doesn't make sense to anything but daytrade, primarily on the short side (betting the market goes down).
And now.. it seems that the predictions we've been hearing are coming true. As the US economy is forcibly weaned off the misspent, multi-trillion dollar government stimulus, we're coming down like a Heroin addict forced to go "cold turkey" in an unpadded cell.
Today "news" was the horrible existing home sales data, fully 30% beneath expectations, as well as hitting a 15 year low. Combine that with a 12 month supply of foreclosed and REO properties over-hanging the market, and it's little wonder there's little incentive for people to buy during what is normally the height of the summer buying season. Folks fully expect home values to come down even more. I know this personally, as I'm in the market for some investment property to deploy capital from my father's estate, since CDs are paying a pathetic return. But buying property only to see it decline in value by a further 10-20% means that it takes at least a couple of years of rental profit to break even.
Things may get much worse as we move into fall and winter, never a good time to sell houses given inclement weather issues.
And tomorrow we get durable goods and NEW home sales, neither of which should be positive given today's numbers. Durable goods are generally items that people either utilize credit to obtain since they often amortize them over the period of use. Household consumer durables, such as appliances, also make up this data, and if fewer homes are being sold and built, fewer appliances are being purchased.
And ultimately, we have the revised GDP data from last quarter, which has already been revised downward once. Expectations are for another downward revision, which calls into question the value of the original data and whether it was "spiked" to create the impression of greater growth than actually occurred. It also calls into question the value of governmental stimulus, since we jacked up the US national debt by approx 10%, yet obtained even less GDP growth than the perceived 3%. That's like taking a $1000 cash advance on your credit card, and putting a couple of hundred bucks into you pocket and calling it "income". I understand the rational for a stimulus, but it was incompetently misspent and failed to achieve an return on investment (ROI) for the US taxpayer. Little wonder there's very little enthusiasm for a repeat.
Btw, again here's the link I use for the week's economic data reports. It's worth bookmarking if you're invested in this market.
As for videos tonight, Chart Pattern Trader has a very good video that all readers should watch.
And of course, Christian at PSA is telling us all to stay short as further selling is to be expected. He makes a compelling case for this via the divergences he's seeing in the Stochastics and price action. Always believe the Stochastics and RSI over actual market price.
I'm currently long TZA and VXX (VIX ETF).. I was stupid and chased TZA today as I sold out my position overnight and it ran up hard overnight, so I'm a bit underwater, but I think the market action will make me profitable in coming days.
I just don't see any reason to go long here, until we reach some level of identifiable support and then only for a bounce.
And btw, if you didn't read this article from my previous post, it's worth posting again. It discusses proposed accounting changes regarding corporate lease accounting. This could have a MAJOR IMPACT on future earnings for S&P companies, forcing a downward revision on book values and increasing liabilities.
I also need to do an post on how FASB "mark to market" accounting played a role in crashing the Securitized Mortgage markets. It's almost as if there is a concerted effort by the FASB to pull the rug out from under the current Corporate accounting rules. Makes one wonder if those original changes were meant to set corporate accounting up for a future fall by permitting them to take what should be consider liabilities, off their books.. only to make them add them again at some future date.
Oh.. and btw, here's a GREAT INTERVIEW with Former Fed Governor Mishkin, who apparently wrote a glowing report about Iceland just months before that country's financial system collapsed. Turned out he failed to mention he was paid $124,000 to write that report by the Icelandic Chamber of Commerce. This represents a clear (and all too common) conflict of interest. And it's very similar to the arrangement the Ratings Agencies had with the Investment Banks when they were paid to give AAA ratings to toxic sub-prime mortgage securities.
It's really amusing to watch him fumble over the interviewers very pointed questions. I really loved the part where he claimed that the title change was a "typo"...LOL!!
He should be investigated and fined/arrested, for failing to disclose such a glaring conflict of interest.
It's crap like this that undermines investor confidence in the public markets and is causing them to boycott them.
Have a good one!!
Scrutinizer
Saturday, August 21, 2010
Selloff to continue?
Been busy the past few days and haven't had the time to keep this blog up to date. But I hope any followers are checking the links I have to the left for some insight into current and future market directions.
And I'm off again this weekend on a new apartment hunt, so the best I can do at the moment is offer some links of interest.
First off, Christian at PSA is informing us of his belief that we currently have 6 confirmation sell signals on the market. I think he makes a compelling case, especially with regard to the divergence between the stochastics/RSI and current market price levels. Something's gotta give and it appears that it's to the downside.
Secondly, Chart Pattern Trader suggests we've seen the end of the summer rally and goes on to discuss Grand Supercycle Trends with Elliot Waves. I don't use EW analysis since it's not conducive to trading, but does provide a good "20/20" hindsight analysis of longer term future trends, once the pattern is clearly established.
And sometimes I receive these free pattern analysis videos from Ino.com. I'll post this one as I thought it was rather intersting as "thought fodder" on market direction:
How A Japanese Chart Formation Could DOOM the DOW
And Richard Russell, Dow Theory GURU since the 1950's is telling his subscribers that the stock market is falling apart:
The stock market is crumbling
Clearly corporations are hunkering down in anticipation of another financial crisis. It's one reason that has been cited for why they are raising so much cash based upon the belief that banks may not be liquid enough to finance their operations.
But are corporations as liquid and cash flush as many assert? Zerohedge had an interesting column citing an Economist article that is discussing current accounting rule changes related to how corporations use lease arrangements to make their balance sheet appear stronger than it actually is. If this accounting change goes into effect in December, it could have the same catastrophic (but necessary) impact on stock valuations as "Mark to Market" accounting did with the banking and mortgage sectors back in 2007 (just before the big crash).
Also, there's been a lot of talk about the "Hindenburg Omen" which, as the theory suggest, sets up a series of conditions that predict an impending market crash (as if the several we've already isn't enough). Zerohedge points out that we now have the 2nd confirmation. Here's a link to the first confirmation.
If I get the chance, I'll update this post with more information as I sift through it. So check back..
Scrutinizer
Sunday, August 15, 2010
Tony Robbins and Goldman Sachs give you their opinions on the economy..
GS trading desk predicting "meaningful decline" in stocks
Fed manipulating stock market?
And this is something everyone of you need to watch. Someone posted this link to a video blog by Tony Robbins (y'know.. the motivational speaker/mentor). Now Tony Robbins obviously has access to some MAJOR financial heavy hitters, given his providing services to many of them, as well as their managing his portfolios and assets.
Tony Robbins: 7 things you should consider about the economy
I was amazed when I heard him mention Credit Default Swaps!!! He specifically mentioned them, rather than just alluding to them indirectly. That caused me to definitely "trigger" on the rest of his comments as derived from credible sources.
Now.. he obviously can't give investment advice. But he CAN pass on some of the information that has been told TO HIM by his financial uber-brain buddies.
I don't normally follow Tony Robbins, but something in his conscience must have motivated him to share what he has learned.
Get short on any rallies, and if you're really bold, get Ultra-Short via the ultra-bear ETFs.
And if your suffering paralysis by analysis, just go cash, pay off debt, and save money (and make sure you have a personal emergency stash that's not in a bank, but well hidden).
Scrutinizer
Thursday, August 12, 2010
Friday the 13th: Part VIIII
Not much time for an extensive post tonight. But let it be recognized that tomorrow is Friday the 13th and I have a gut feeling that there won't be many folks willing to buy and hold these markets based upon that superstition. Just a hunch I have, but it also appears we're in a continuation pattern on the charts, suggesting more downside tomorrow, with a possible reversal and relief rally on Monday.
It's ALSO "Cardinal Climax", which is the very rare alignment of a number of planets. Those who apply astrology to market sentiment (I'm not one of them, but there are many who do) have been suggesting major turmoil during this period.
Cardinal Climax
Query "Cardinal Climax" and you'll find a plethora of astrological sites explaining it.
Other than that, I'll let some other folks give their opinions on market dynamics for tomorrow:
PSA August 12th chart video
Chart Pattern Trader's take
August 13th chart reading (it may only be available on the 12th through 13th)
It's also hard to say what kind of candlesticks we've put in today. I've voting for a continuation tomorrow and more downside based upon what I see as a "on neck" continuation pattern on the SPY (S&P 500 Spyder ETF):
SPX daily
SPY Daily
On Neck Continuation pattern
Folks should also recognize that the past two weeks of market upside was wiped out in two days. That's NOT a very positive sign of underlying market strength. And now, all of those people who were buying over the past two weeks are currently underwater and will be looking to get even and get out.
So.. tomorrow we have Consumer Price Index information at 8:30 AM followed by Retail Sales. Both are considered market moving events. If you don't have this website bookmarked, you shouldn't be trading stocks.. ;0)
Economic Calendar
Any bad news tomorrow morning and we could have a violent sell-off.
That's all I have right now..
Scrutinizer
Friday, August 06, 2010
Credit Default Swaps: How To Blow Up A Financial System
Most folks on "Main Street" have heard the news about how Congress is attempting to regulate dangerous Derivatives, which are a financial instrument that derives its value from the price of an underlying asset. They know that abusive derivatives trading contributed to the financial crisis of 2008. They know that derivatives abuses brought down AIG, requiring the US government to loan them billions to remain liquid.
But most have never heard of Credit Default Swaps. If they have heard them discussed on the evening news, it's doubtful they actually understand what they are or how they have contributed to the financial mess the world finds itself in. And most do not realize that it was rampant CDS writing (selling CDS contracts) by 159 rogue traders at AIG, that resulted in bringing that huge insurance company to bankruptcy requiring the US taxpayer to bail them out and save the global financial system. CDS remain one of the most under-reported, mis-understood, financial instruments currently in existence.
The grievous problem of Credit Default Swaps is an issue I've been meaning to address for some time now. But it's a complex subject so I've held off until I had the time to properly address it. Rolling Stone is reporting on how the FINREG legislation, which was supposed to make these CDS transactions transparent, was effectively gutted and allowed Wall Street to resume "business as usual". Matt Taibbi, of Rolling Stone Magazine, has previously published a series of articles investigating Goldman Sachs and their involvement in the financial crisis of 2008
Wall Street's Big Win
But before you read that, here's some background on what a Credit Default Swap actually is.
Essentially, a CDS is unregulated financial "insurance" (though CDS traders go to great lengths to assert that it is NOT insurance). Two parties enter into a PRIVATE contract (not transparent to the market) buying and selling protection against the default of some underlying asset. HOWEVER, unlike typical regulated insurance, the two parties don't have to actually have an insurable interest in the underlying asset. These entities are known as "counter-parties" to that CDS contract.
Wikipedia gives a good explanation:
"A holder of a bond may “buy protection” to hedge its risk of default. In this way, a CDS is similar to credit insurance, although CDS are not similar to or subject to regulations governing casualty or life insurance. Also, investors can buy and sell protection without owning any debt of the reference entity. These “naked credit default swaps” allow traders to speculate on debt issues and the creditworthiness of reference entities. Credit default swaps can be used to create synthetic long and short positions in the reference entity.[4] Naked CDS constitute most of the market in CDS.[5][6] In addition, credit default swaps can also be used in capital structure arbitrage."
Edit: August 22, 2010: Here is an excellent article discussing the problems with developing a transparent clearing market for CDS derivatives, as well as CCP (central counter-parties) capital requirements and risks of oligopolistic (monopolistic) control over derivatives clearing.
The Sausage Marking begins..
CDS positions LACKING any insurable interest, are called "Naked CDS". They are essentially private BETS (eg: gambling) between two parties on whether an asset (that neither actually own) will default.
Now.. put that in terms that apply to each of in our daily lives. Imagine I'm able to purchase insurance on YOUR HOUSE, OR CAR, from a counter-party that will pay off if your house burns down. I don't own your house, nor am I a lender to you. But I'm able to purchase a "financial interest" in seeing your house burn down, or for your car to be stolen.
Naked CDS are like buying Fire Insurance on your neighbor's house
And even if I don't burn your house down in an act of direct arson, or sabotage your car, I can make you look like an incredibly poor credit risk by manipulated the cost of insuring your house. Supply and Demand for CDS would dictate the price of the insurance premium you pay to insure your own home. Therefore, if you have a thousand people demanding to buy insurance on your home, it would create the impression (to your insurer and bank) that you were ready to default at any moment, or that you were running a Meth lab in your home. Therefore, your insurance premiums would rise, and the perceived market value of your actual home, or just the mortgage note, would decline dramatically. All because a bunch of speculators have "ganged up" on you to make you look like trailer park trash to your creditors and insurers.
Thus, it's little wonder that participants in the CDS markets do not want them classified as insurance, let alone regulated as such. Because Insurance REQUIRES an insurable interest.
And, IN FACT, insurance was originally sold in a very similar manner to CDS. One didn't have to have an insurable interest to buy life insurance on another person. In effect, insurance PRIOR TO REGULATORY REFORM AND REQUIREMENTS was just a form of speculative gambling. Only by passing laws and regulations were these "surety bets" morphed into the actual insurance industry as we know it today.
But still the defenders of CDS parse words and split semantical "hairs" to keep them from being classified as insurance and requiring insurable interest in any CDS contract:
Repeat after me: CDS are not insurance
But the concept of such contracts not requiring insurable interest is nothing new.. Lloyds of London, once (or still are) the preeminent insurance entity, used to sell insurance on cargo ships to individuals lacking an insurable interest. It resulted in such an increase in insurance fraud (in the form of "accidental" sinkings, if not outright contracted piracy) that it resulted in Parliament passing the Maritime Insurance Act of 1746:
Maritime Insurance Act of 1746 Page 182
Legal Basis of Insurance: Insurable Interest
What's the bottom line about CDS?
Here's what the average investor has to think about. If powerful financial entities can purchase "insurance" via CDS on assets they do not hold, then they have every interest in seeing those assets devalue and default. At a personal level, if I wanted to force you and everyone on your block to sell your property to me so I could build a mall, all I would need to do is make financially intolerable for you to maintain your home insurance and mortgage. If you default on your mortgage, I own your house, as well as the property underneath it.
If I want to own your business or take you out as a competitor in the marketplace, I can round up a "cabal" of Naked CDS holders to devastate your perceived credit worthiness and make it untenable for you to issue debt for business expansion.
Now.. let's take this to the Sovereign debt level, what if I want to make your country's debt appear to be junk status? I get a bunch of my hedge fund buddies to buy CDS on your country's sovereign debt and force up the cost for you to insure and roll over that debt in the markets. This is what has happened with Greece and many of the other smaller, debt ridden states in Europe. As CDS premiums rise, so does the interest rate the market demands to roll over that debt. The only means by which a default can be prevented is for other nations (and their taxpayers) to front them money to "re-insure" that debt to prevent default.
Are you seeing the problem? To prevent sovereign collapse of their debt, taxpayers are put on the hook and money is "extorted" from them to prevent an even more grievous failure of the financial system. To prevent the collapse of both US and European banks considered "too big to fail", the US taxpayer was "blackmailed" into saving AIG and other banks via TARP. And then the Europeans were required to bail out Greece and (potentially) the other PIIGS at European TAXPAYER expense.
European CDS WMDs targeting Spain?
Now.. we have to ask ourselves, as common investors, why would we want to purchase ANY CORPORATE STOCK, OR DEBT, when such unregulated speculative FINANCIAL WEAPONS OF MASS DESTRUCTION are available to ATTACK the global equity and debt markets?
It's hard to imagine a better financial "tool" for transferring wealth from the masses (eg: taxpayers) to the few by destroying the value of their assets, whether equity or debt instruments.
It's also a fantastic tool for "supra-national" entities, or even sovereign countries, to conduct economic warfare to weaken their opponents and rivals, as well as sovereign states.
Heck, even China is now apparently being targeted by CDS speculators:
China CDS speculation rising.
This is why I've basically given up owning stocks for the long-term. I trade ultra-bull and ultra-bear ETFs and try to bank cash every day. And since Ultra-Bear ETFs are essentially CDS contracts on the underlying index, I recognize that, failing to "beat them", I've been required to join them... But I don't like the fact that I'm making money betting on the destruction of the US equity and financial markets, but right now that seems to be the only recourse left to me in an environment where our elected representatives are UNWILLING to regulate the CDS markets.
But destroy them they will, unless sovereign governments and their citizens DEMAND that they be regulated on a global basis, or outright banned as legally unenforceable contracts.
Scrutinizer
More reading on CDS and their financial impact:
Dissecting a Strange Financial Creature
CDS: Useful Risk Management Tool or Financial WMD?
Credit Default Swaps and Financial WMDs
CDS: The Monster that ate Wall St.
Wednesday, August 04, 2010
Pride Cometh Before The Fall?
Markets appear to be in a Rising Wedge formation during this period.
Rising Wedge Pattern
S&P daily chart
This is similar to the pattern that was observable (to the astute Technician.. ;0) back in April before the May "flash crash":
S&P 500 Rising Wedge during April, 2010
Also, I came across this link to a MUST READ Economic outlook that is predicting a recession in late 2010, early 2011. There are a lot of charts and discussion, but it should be understandable to even the layman out there.
The Future Recession In An Ongoing Depression (click on the embedded article for full screen viewing)
The primary crux of Pal's analysis is that the only economic growth we've had in the past year has been due to spending over a Trillion Dollars in government stimulus. Factor out that stimulus and it's evident that we're still in a recession/depression. It has NOT resulted in providing a buffer for GDP growth until the private market recovers.. The private market is still hunkering down, if not contracting, and they continue to lay off workers, therefore reducing consumer demand.
Now.. does that mean the market can't go higher? Again, I'm being VERY TACTICAL in my trading, and not yet betting on the "strategic turn" where I go all in and don't worry so much about trading, but more on riding the overall trend. It's coming, as all the fundamental data seems to indicate, but I don't want to be predicting the turn, but ready to be reactive when it finally manifests itself in a clear manner.
I see Christian from PSA is stepping out on a limb in predicting a sell-off prior to the Friday Unemployment report. The poor guy is STRATEGICALLY correct, but as for timing his swing-trade, he's obviously suffering a lot of pain.
Sell-off before Employment report?
I'm looking more at the SPX weekly chart with 100 Week MA for signs of ultimate direction to the market. It's going to lead every other US index.
Watch that MACD indicator.. If it continues upward in coming weeks, it's a powerful predictor of future price action.
Finally, I'm watching some of the currency turmoil we're seeing. The Yen is near a 15 year high against the USD and that is not a situation that can long continue without dramatic impacts on Japan's ability to export. Furthermore, the Euro has had a tremendous run since it's previous low of 1.18 against the USD. Part of what has apparently driven the US stock markets has been the decline of the USD.. Same can be said for oil and commodity prices, most of which are valued in USDs. The USD declines, the relative value of the stock and commodities markets appreciates. Watch for a reversal of this trend.
I often look at UUP, which is the USD bullish fund.. Plug it into the chart above and play around with it. Also, look at the VIX (VXX).. There is a new ETF that is the inverse to the VIX (XXV) that is going to be interesting to watch. The lower the VIX goes, the higher goes the equity markets.
That's all I have tonight.. Probably won't be trading tomorrow.. Got other obligations.
Scrutinizer
Tuesday, August 03, 2010
Signs of Impending Market Crash
I came across the link to this EXCELLENT SUMMATION of all the warning signs indicating another market crash. It's very readable to the layman, as well as the Technician.
Warning signs of impending market crash
Also, I get these emails from Stocktiming.com from time to time and they often include free charts. I'm currently contemplating a test subscription and will provide my review in a future post whether it's worth the money.
Anyhoo.. Marty Chenard brings up a VERY IMPORTANT point that helps us to analyze why the markets have performed they way they have. It has to do with "liquidity" in the financial system.
Do we have enough Liquidity in the system?
What's apparently from that chart is that the Fed was adding cash liquidity to the system at a breakneck past from March, 2009 up until April, 2010. They would drain ever larger amounts of liquidity, then ramp it up.. then drain even more.. Like weaning an Meth addict off a 12 month bender.. You can't do too much, without giving them a temporary fix.. but then you give them less and less.
However, just before the "Flash Crash" the Fed drained a ton of liquidity with the result that the market crashed. We've been fluctuating in "contraction" territory ever since then. But Chenard is telling us we're currently close to neutral and there are indications that the Fed is going to expand the money supply again based upon lagging economic data concerns.
No good "bringing down" the patient from his "addiction" if the result is that the patient dies as a result.
I don't know where Chenard gets his data on liquidity, but it does seem to show definitive correlations to market performance..
Can it be that easy? And doesn't that suggest that all market moves are "manipulated" by the supply of money in the system?
I'll have to do more reading on the subject and report back.
But in the meantime, be sure and read that article on "Warning Signs"..
And for your viewing pleasure, here's PSA's latest video on "exhaustion gaps".. It's a good lesson for aspiring Technicians to remember.
Exhaustian Gaps = Bear Market
Scrutinizer
Monday, August 02, 2010
Some Market Thoughts..
My apologies, beforehand, for any haste I show in putting this post together.
The Dow was up over 200 points today on the lowest ISM number since we "emerged" from the recession, but one that came in within estimates and still reflect positive economic growth.
Poor Christian, at PSA, failed to see the possibility of this low-volume uptrend being able to continue, despite his many short calls.. But this rally one can't be ignored, even though it's built upon flawed fundamentals and market technicals. It happened before during the period between January and April, and it appears to be happening again, potentially setting up for an October crash, which seems to be a favorite period for crashes.
Bulls can't win, Bears can't lose..
I actually agree with Christian, but I'm not as adamant about believing the crash is around the corner now. There are some financial "forces" at work that are hell-bent upon avoiding succumbing to bearish market readings.
And here is a look at global markets from Colin Twiggs who offers a free subscription to his excellent Technical Analysis insights:
Consolidation in a Bear Market
All of this economic data can be spun any number of ways, but the analyst must remember that it's based upon numbers that still include, BUT NOW ABSENT, government stimulus. And as the ECRI numbers (see below) indicate, we're ALREADY at a level where every other previous instance has resulted in recession. And any future data will reflect an economy not "juiced up" by government stimulus.
So I'm still not sold on a recovery, nor the resumption of a bull market.. No.. Not YET... This next two quarters will be the determining factor and we'll have to watch the weekly economic data before we're able to determine where we are.
But just because I'm not "sold" on recovery, not until I see the S&P 500 trading above 1250 which would quell fear of the Head and Shoulders, and set the index to revisit previous highs, AND we see positive trending economic and employment data. But it's hard to visualize such an event naturally occurring for the foreseeable future. And it's even more difficult to understand how this market has been climbing, on pathetic volume, and in the face of proven market indicators that suggest it's due for a 20% retracement and consolidation from it's March, 2009 lows. Even experienced market professionals are being whipsawed by this market action and it's undermining the public confidence in the equity markets.
But don't let it be thought that I want the market to continue crashing, or to live through another depression. I don't. I have NO INTEREST in seeing us slide into an economic hell. I only want to identify when it happens and protect myself, and my friends and family, from its effects.
And that's why I remain a short-term trader, buying and selling both ultra-bullish and ultra-bearish ETFs until we see some actual market and economic direction we can believe in. And many other investors are just selling out completely and hoarding cash. We've also seen hedge funds de-leveraging and standing on the sidelines waiting for direction.
But one thing that is paramount in avoiding recession, at least in the eyes of the Federal Reserve and Treasury dept, is that if consumers are not spending, a recession is nearly guaranteed. The velocity of money in the economy must be restored, as well as halting the de-leveraging consumer and debt defaults. If the "wind" (money) flowing through the economic "windsock" tapers off, then the economy will, like an actual windsock, sag and decline.
Now, I think there is significant evidence that would suggest that the value and direction of the stock market is critical to impacting the psychology of the average consumer, especially if their 401Ks have basically "flat-lined" for the past 12 years.
So.. is it possible that the Fed has been either directly buying, or facilitating the purchase by banks/institutions, of equities and equity futures, in order to ward off the insidious Head & Shoulders formation that I've been discussing and restore investor confidence, and therefore, consumer confidence?
Actually, this is not a new thought.. There was some commentary back in March from the CEO of Trimtabs, a VERY REPUTABLE firm that tracks all kinds of market data suggesting that the markets are being rigged by the Fed (or someone):
Who's buying the market?
It's frightening (to me) when such a reputable firm starts to question the independence of the markets from Fed/Gov't interference. And recall that this was BEFORE the "flash crash" of May 6th when investor money REALLY started flowing out of the markets.
Here's another article that discusses the global banking systems increases in Money supply over the past year. And it suggests that this is, in good part, reason for why the stock markets haven't crashed.
Money Supply expanding?
But that's also called a HUGE "moral hazard", if not a huge violation of the concept of "Free Markets" which could quickly ignite major inflation if people start believing the Fed and other Central Banks are effectively putting a floor under equity prices.
There's also another possibility, for which I have absolutely no evidence, but could explain why the Fed would be tempted to take the unprecedented step of intervening in our equity markets. Could it ALSO be that our markets have been under attack by foreign sources/governments via Credit Default Swaps? Could it also be that these "supra-national financial forces", only holding loyalty to profit, also attacked European based financial interests via our own CDS attacks against European debt? This is a theory that I've been trying to accumulate evidence for ever since I finally understood the destructive nature of CDS as a financial instrument.
Since CDS make perfect financial "weapons" due to their nature as "private contracts" not transparent to the rest of the markets, their use can be perceived as a national security threat. And such an attack could necessitate an active defense of our financial system and equity markets until such instruments are fully regulated and controlled (supposedly via "FINREG").
Here's another article comparing the housing bubbles in other parts of the world compared to the US. We weren't the worst, but given what the US is enduring, it will be not be very pretty as these other bubbles get popped.
Global Housing bubble choking World banking system
And Mish had some discussion of the under-reported (didn't see it on any business news websites or broadcast) ECRI data that's indicating we're set for another recession. Remember "double-dip" is essentially the same as a Depression.. They just don't want to call it that until the history books are written.
ECRI data is negative, practically guarateeing another recession
So.. the bottom line is that while the economic data doesn't support a higher stock market price at this time, it's likely we're going to get it for the foreseeable future because the "powers that be" refuse to let the markets fall.
The question is how long they can keep up this charade without publicly revealing their hand?
That's all for now..
Scrutinizer
Wednesday, July 28, 2010
The Market: All Bull and No Bear?
Market short interest is at an 2 year low and I find that VERY INTERESTING in it's ramifications.
For weeks I've been referring to the negative fundamental and technical picture of both the economy and markets, especially with regard to the H&S technical formation portending a dramatic fall in the indices. YET, there seems to be very little confidence amongst the bears in taking advantage of that scenario.
Within that link it refers to Barton Biggs, but what it did not state is that he JUST mentioned this week that he is 75% LONG. Now, Mr. Biggs is NO FOOL. He runs a multi-billion dollar hedge fund, Traxis Partners. He's made some good calls in the past, receiving considerable praise. But he missed the recession in 2008 and lost 10% based upon that call.
But given that within the past two weeks he's made a MAJOR change in his market outlook, going from being a seller to a buyer, that's a serious shift in sentiment that cannot be ignored. What is it that he sees that the rest of the market doesn't?
We've received nothing but continuing bad economic news. Yes.. corporate profits have been decent, but the market is a forward predictor of economic activity and should be following the negative data we're seeing. Consumer Confidence is at a near all-time low, while Durable Goods data came in negative -1%, when it was expected to be positive. We don't have anymore government stimulus.
So if there is a major lack of short interest, WHAT IS DRIVING THIS MARKET UPWARD?? It certainly isn't a "short squeeze", which is normally the "fuel" for a major market upside reversal. The short positions just aren't out there. And it's not "smart money", because the volume doesn't reflect major commitments on their part (as Christian from Perfect Stock Alerts contends that it's all "retail" buying). Or is "smart money" actually involved? That's where Mr. Biggs' opinion is so important.. Barton Biggs IS SMART MONEY, although admittedly sometimes wrong. But he could also just be "talking his book" and looking to sell his long holdings post-earnings and possibly ready for a market downturn.
So with those negative technical and economic data, why isn't everyone, and their grandmothers, short this market? And what is driving this market upward? There has been constant rumours over a "Plunge Protection Team" (President's Working Group on Markets) efforts to avoid market crashes. Could it be that this "entity" has been coordinating the "HFT computers" and "black boxes" to prevent that H&S formation from shaving 20% off the markets?
Could it be that "smart money" recognizes that the "fix is in" and are unwilling to bet against it? So they have no choice but to "go long".
Were I the President of the USA, recognizing that I don't want to go down in history as the President who ushered in the second "Great Depression", I would probably authorize possible means to keep those markets from going down, especially when it was apparent there is no further appetite for another trillion dollar (wasted) stimulus.
All I can say is that we're currently looking at serious "gap-ups" in the market that need to be filled. But as we saw last spring, it could take 5 months (January to May "Flash Crash") to fill those gaps and that could result in serious pain for anyone foolish enough to go bearish..
But THEN AGAIN, without the existence of those short positions, it's hard to quantify exactly what is going to continue fueling this rally.
Hopefully, the "PPT" will be able to stave off a major market crash (I certainly don't want one), instead putting us in a long-term, range bound, trader's market (which I would love) until economic data is stronger.
Scrutinizer
Friday, July 23, 2010
Run Forrest, RUN!!!
Market action during last week was fast and furious, with major gaps to the upside likely due to short covering, Human and HFT (computer) trading. But, as you might recall from a previous post, the retail investor is heading for the safety of bonds and cash in a big way and market volume remains light. But the S&P closed above 1100, which was an important level of resistance that stood in its way and that cannot be ignored.
But the importance of this is that the market is attempting to nullify the Head & Shoulders formation, by creating an INVERSE Head & Shoulders, which could drive the S&P and DOW to break through the April, 2010 highs. It's also possible that, in a best scenario, it puts the markets into a wide trading range, similar to what has been seen in Japan, or during the '70's.
Now, Christian at PSA is warning Bulls not to believe this rally. But since I'm a day and short-term swing trader, we cannot ignore such a rally, which could take us up 600 Dow points from here. I'll confess I felt considerable pain in my TZA position before finally throwing in the towel and taking my licks.. Now I'm looking for direction and "hit and run" opportunities.
Christian brings up extremely valid points regarding the European "stress test", which I believe was financial "propaganda" to divert attention from the potential for sovereign debt default. But good propaganda is good propaganda and can mask the facts for awhile. He also mentioned North Korea, which has ALWAYS been a problem that could erupt at any minute. But those are bearish arguments that won't impact the markets until they impact the market.. ;0) And in between, being short this market is going to negatively impact your trading account.... lol!!
We're also entering a Full Moon phase, for those who follow the Moon Phase Trading System (MPTS) , and that has often led to market turns. In fact, this major rally BEGAN back on June, 26th, during the last Full Moon. You'll notice also in that link that the VIX is under massive pressure, now falling under it's 200 Day MA. And since the VIX is a strong INVERSE indicator of market direction (the lower the VIX, the stronger the markets), until we see it get back above the 200 DMA, this market is going to get stronger.
Bears BEWARE!!
But the KEY INDICATOR I think we need to watch is the S&P 100 Week MA. 1100 put the S&P 500 above that 100 Week MA and that's SIGNIFICANT. If the S&P can manage to drag that 100 WMA back above the 200 Week MA at 1150, it's "game over" for the bear case for a couple of months. Another indicator is that the Russell 2000 (RUT) has already achieved this (which is why I probably felt so much pain last week.. ;0) (insert RUT in that chart link).
Right now I'm starting to get less bearish in the face of extraordinary manipulation that is clearly going on in the markets from the High Frequency Trading platforms. I don't believe we're going to get much good economic news in coming months, but a savvy trader learns over time that "the market is always right", especially when money is involved.. ;0) The trend is your friend and that trend seems to be getting even more bullish and the shorts are getting scared.
How long will this trend last? It might end at 1150 on the S&P, which could prove to be a key reversal point. And that's why I included discussion of the RUT. If the small cap Russell 2000 can break that 100 WMA resistance, it stands to reason that the DOW and S&P will do the same.
Bear Case
Edit: I'll be accumulating some stuff to support the bear case. Right now it primarily revolves around the FOREX market response to the European "stress test". Bloomberg is reporting that the Euro is falling in response to lack of confidence that the tests were stringent enough. This is an argument, I might add, has a lot of credibility since they didn't count sovereign debt held to maturity, much of it from the PIIGS (Portugal, Italy, Ireland, Greece, and Spain). The whole purpose of the stress test was to put to rest the opinion that some of these PIIGS might be at a point where they will need to default on their debt because they lack the economic growth to pay for it.
So how does a falling Euro affect the US? Cheaper Euro, Stronger Dollar.. they can sell more stuff to us than we can to them and that impacts US export profits. And as we saw from the previous crisis in the Euro, it led to global market sell-offs, so it's an "event risk" that can't be ignored and which could QUICKLY derail the bullish scenarios I mentioned above.
Euro falls on stress test concerns
And for those who watch the stars, supposedly Aug 1st will result in the "Cardinal Climax", which is series of 5 planet alignments that is apparently very rare.
And don't scoff!! There are a large number of market technicians who use Moon Phase Trading Systems and planetary alignments to confirm other indicators. And since stock market is based upon "herd mentality", if people believe something will come to pass (like that H&S formation I keep referring to), then it will. If you doubt the veracity of this, think about the origin of the word "Lunacy".. Yep.. it came from the observed propensity of people to act strangely during a full moon.
More on "Cardinal Climax"
That's all I have for now.. I may add/edit this post later this weekend.
Scrutinizer
Market action during last week was fast and furious, with major gaps to the upside likely due to short covering, Human and HFT (computer) trading. But, as you might recall from a previous post, the retail investor is heading for the safety of bonds and cash in a big way and market volume remains light. But the S&P closed above 1100, which was an important level of resistance that stood in its way and that cannot be ignored.
But the importance of this is that the market is attempting to nullify the Head & Shoulders formation, by creating an INVERSE Head & Shoulders, which could drive the S&P and DOW to break through the April, 2010 highs. It's also possible that, in a best scenario, it puts the markets into a wide trading range, similar to what has been seen in Japan, or during the '70's.
Now, Christian at PSA is warning Bulls not to believe this rally. But since I'm a day and short-term swing trader, we cannot ignore such a rally, which could take us up 600 Dow points from here. I'll confess I felt considerable pain in my TZA position before finally throwing in the towel and taking my licks.. Now I'm looking for direction and "hit and run" opportunities.
Christian brings up extremely valid points regarding the European "stress test", which I believe was financial "propaganda" to divert attention from the potential for sovereign debt default. But good propaganda is good propaganda and can mask the facts for awhile. He also mentioned North Korea, which has ALWAYS been a problem that could erupt at any minute. But those are bearish arguments that won't impact the markets until they impact the market.. ;0) And in between, being short this market is going to negatively impact your trading account.... lol!!
We're also entering a Full Moon phase, for those who follow the Moon Phase Trading System (MPTS) , and that has often led to market turns. In fact, this major rally BEGAN back on June, 26th, during the last Full Moon. You'll notice also in that link that the VIX is under massive pressure, now falling under it's 200 Day MA. And since the VIX is a strong INVERSE indicator of market direction (the lower the VIX, the stronger the markets), until we see it get back above the 200 DMA, this market is going to get stronger.
Bears BEWARE!!
But the KEY INDICATOR I think we need to watch is the S&P 100 Week MA. 1100 put the S&P 500 above that 100 Week MA and that's SIGNIFICANT. If the S&P can manage to drag that 100 WMA back above the 200 Week MA at 1150, it's "game over" for the bear case for a couple of months. Another indicator is that the Russell 2000 (RUT) has already achieved this (which is why I probably felt so much pain last week.. ;0) (insert RUT in that chart link).
Right now I'm starting to get less bearish in the face of extraordinary manipulation that is clearly going on in the markets from the High Frequency Trading platforms. I don't believe we're going to get much good economic news in coming months, but a savvy trader learns over time that "the market is always right", especially when money is involved.. ;0) The trend is your friend and that trend seems to be getting even more bullish and the shorts are getting scared.
How long will this trend last? It might end at 1150 on the S&P, which could prove to be a key reversal point. And that's why I included discussion of the RUT. If the small cap Russell 2000 can break that 100 WMA resistance, it stands to reason that the DOW and S&P will do the same.
Bear Case
Edit: I'll be accumulating some stuff to support the bear case. Right now it primarily revolves around the FOREX market response to the European "stress test". Bloomberg is reporting that the Euro is falling in response to lack of confidence that the tests were stringent enough. This is an argument, I might add, has a lot of credibility since they didn't count sovereign debt held to maturity, much of it from the PIIGS (Portugal, Italy, Ireland, Greece, and Spain). The whole purpose of the stress test was to put to rest the opinion that some of these PIIGS might be at a point where they will need to default on their debt because they lack the economic growth to pay for it.
So how does a falling Euro affect the US? Cheaper Euro, Stronger Dollar.. they can sell more stuff to us than we can to them and that impacts US export profits. And as we saw from the previous crisis in the Euro, it led to global market sell-offs, so it's an "event risk" that can't be ignored and which could QUICKLY derail the bullish scenarios I mentioned above.
Euro falls on stress test concerns
And for those who watch the stars, supposedly Aug 1st will result in the "Cardinal Climax", which is series of 5 planet alignments that is apparently very rare.
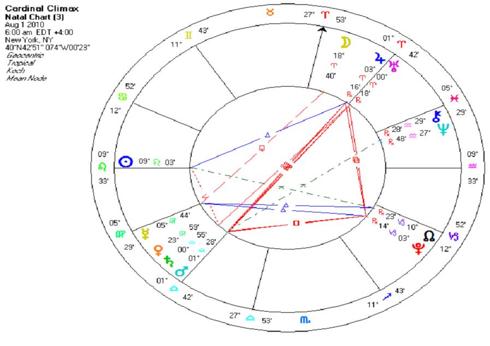
And don't scoff!! There are a large number of market technicians who use Moon Phase Trading Systems and planetary alignments to confirm other indicators. And since stock market is based upon "herd mentality", if people believe something will come to pass (like that H&S formation I keep referring to), then it will. If you doubt the veracity of this, think about the origin of the word "Lunacy".. Yep.. it came from the observed propensity of people to act strangely during a full moon.
More on "Cardinal Climax"
That's all I have for now.. I may add/edit this post later this weekend.
Scrutinizer
Thursday, July 22, 2010
Retail Investors CONTINUE TO RUN from this market, yet the computers drive the market higher!!
Mutual Fund outflows continue for 11th week
As I posted on 7 July, it had appeared that outflows were declining, but that's no longer the case.
ICI reports that the week ended July 14 saw another massive outflow from domestic equity mutual funds of $3.2 billion, bringing the July total to $7.3 billion, and year-to-date equity outflows to a stunning $37.5 billion.
It would seem that outflows are INCREASING as that $7.3 billion is a BIG CHUNK of the past 7 months of data.
How can we have a "bull market" when money continue to flow out of it and 10 year Treasury Bond yields are still under 3%?
It's another reason the "little guy" hasn't trusted the market since the May 6th "flash crash"
Scrutinizer
China's Real-Estate Ponzi scheme, revisted
Mish did a pretty good write up on China's "Shark Loan" Ponzi scheme yesterday. Essentially is suggests that a great deal of China's internal economic growth has been fueled by a scheme where people take out Home Equity Loans against houses that have ballooned in value over recent years. They then loan that money back out to "Shark Loan" entities at higher rates of interest.
Much of this relies upon China's "shame" based culture, where severe loss of face (and maybe limbs/digits.. ;0) is incurred when a loan is not repaid.
This also corresponds when one of Mish's articles discussing the pressure Chinese men feel in buying their own homes. It seems that Chinese women won't date a man who doesn't have the "nest" already lined up for their future spouse. What incredible pressure these poorly paid men must be feeling in a country where men already outnumber women.
Chinese gold diggers say "show me the house"
Be sure to check back later.. I may add to this post.
Aug 2nd, 2010 EDIT:
Interesting new reports of growing civil unrest in some Chinese cities over the collapse of Real Estate Ponzi Schemes:
Chinese gov't fear civil unrest over collapsed Ponzi schemes
Scrutinizer
Tuesday, July 20, 2010
Why the developed world's worst performing economy has such a strong currency
A good friend of mine, who lives in Japan, was commenting on how the Yen had appreciated against the USD in recent months.
No yearning for Yen?
Thought it was very interesting that the "curse" of not having a widely held currency equates to strengthening of such. While the US and Europe are waging "currency wars", with China trying to disentangle itself from the USD peg), the Yen is reacting to internal dynamics. A stronger currency often translates into a lower equity market (the value of each gets priced in stronger currency and therefore "deflates").
Here's another article from ZeroHedge that discusses Japan's mounting national debt and what it means for Western investors, as well as Japanese savers.
Japan: Land of the Rising Debt
As for today's market action, it was a complete "whipsaw" that shocked even myself. I'm seeing a lot of chatter tonight amongst bulls and bears about what the significance of today's action means for the rest of the week and thereafter.
Here's an interesting discussion that I thought put it into perspective, given the lack of volume to suggest a new bullish phase:
Rally at highs sets up reversal
And, of course, Christian from PSA remains bearish on the overall trend of the markets, and especially makes a point about the light volume. But he does admit that we may be looking at a short-term bounce (which he says we should short):
It's just a bounce, stay short
And Daryl Guppy gives us an interesting read on the currency fluctuations in the USD, which likely had a lot to do with today's rally. He believes the recent sharp downward move is nearing a bottom (which likely means the Euro is nearing a top) and that could put pressure on the US equity markets.
USD finding support @ .82
Now.. I'm extrapolating the stock market possibilities from Daryl's comments.
Now.. put on your tinfoil hats and get ready for some true "Rod Serling" material:
TZ theme
I have a follower, and participant on the Yahoo TZA thread you has posted this incredibly interesting chart that compares the market movements of the current S&P 500 to that of May, 1936. It's DOWNRIGHT UNCANNY how closely it's followed that period:
S&P 500, today and "yesteryear"
Now I have NO EXPLANATION for this occurrence, which would make any Conspiracy Theorist literally drool over the irony. It's almost like someone's plug in the 1936 market program into the High Frequency Trading computers to create a near perfect emulation. Now I don't seriously recommend that anyone use this as a trading guide, but it certainly is one of those "things that make you go hmmm... "... ;0)
Hang tough traders.. Tomorrow will be an interesting day.. Watch China and Europe for clues.
Scrutinizer
Saturday, July 17, 2010
SP 500 Technical Chart review (revisited)
Thought I might include portions of a post I placed today on the TZA thread because I think it clearly explains what the market is facing right now.
Pay particular attention to the SPX Weekly chart with 100 Week MA and the MACD indicator, current and past and how the market has reacted after the Weekly MACD has gone negative on the weekly chart.
*********************
We'll also need to look for a reverse H&S formation developing, as it did at the previous March, 2009 low.
For the SPX to avoid forming a reverse H&S reversal pattern, we need it to break previous lows.
SP 500 weekly chart w/100 week MA
As you can see from the above weekly chart, the SPX got rejected EXACTLY at the 100 Week MA with a shooting star candlestick (inverted hammer). That's not good.
Candlestick charting reference
It also put in the 3rd upside prong of a revised downward channel for Technicians to draw channel lines through.
And if you look at that chart from that 10 year perspective, it resembles a HUGE BEAR FLAG.
Bear Flag chart formation
But most importantly, look at the Weekly MACD. It's negative.. So backtest the chart and look for previous instances where the market has suddenly rallied to the upside and pulled that weekly MACD back to the positive WITHOUT A MAJOR PLUNGE OCCURRING FIRST..
Can't find any? Neither could I.
Look again.. Use "All data" as Time period.
Still can't find any? Neither could I.
It's clear that when the SPX Weekly MACD breaks to the negative, it has ALWAYS plunged to clear oversold conditions PRIOR to any recovery.
EDIT: I just reviewed this article from DecisionPoint.com (see my link list). They have issued a long-term sell signal on the markets:
DecisionPoint issues long-term sell signal
4-Year Cycle Ambiguity
Stay long this market at your own financial risk. Go to cash and wait for the "Smart/Big Money" to come back in and support the markets as they did in March, 2009.
Or if you're patient enough and can handle the volatility of the inverse market ETFs, buy a position in them to profit from the market turmoil.
Scrutinizer
Friday, July 16, 2010
Federal Reserve minutes warn US economy won't recover for 5 more years
Here's one of these little tidbits that most Americans don't read in an American newspaper, or hear being uttered from our President's (or any banker's) mouth on Sunday Morning talk shows.
The Fed minutes warned of "significant downside risks" and a possible slide into deflation, an admission that zero interest rates, $1.75 trillion of QE, and a fiscal deficit above 10pc of GDP have so far failed to lift the economy out of a structural slump.
"The Committee would need to consider whether further policy stimulus might become appropriate if the outlook were to worsen appreciably," it said. The economy might not regain its "longer-run path" until 2016.
"The Fed is throwing in the towel," said Gabriel Stein, of Lombard Street Research. "They are preparing to start QE again. This was predictable because the M3 broad money supply has been contracting for months."
Fed admits economy likely won't recover until 2016
Regular readers of this blog will recall that I posted a chart on M3 money supply declining at a rate not seen since the Great Depression. They would have been forewarned that this is a clear sign of de-leveraging, including folks getting "debt free" and others defaulting on their credit cards and mortgages.
I posted the following link on June 1st, 2010:
M3 collapsing at 1930's rate
We must all recall that debt equates to money supply. The money we deposit into our banks accounts are actually loans to that bank. They turn around and re-lend it to other borrowers at a 9:1 ratio. Simplistically stated, they loan out up to $9 for every $1 in deposits, betting that the majority of those extra loans will not default. So.. for every $1 in your account, $9 more dollars are added to the money supply.
However, when loans start defaulting, or consumer demand for borrowing diminishes (either due to lack of creditworthiness, or just lack of demand), those banks have to pay interest on deposits with less interest revenue from the remaining loans they have extended. And when loans default, they have to write them off and pay out from remaining interest revenue.
All of this results in the destruction of money supply, and usually price deflation due to ebbing consumer demand. Additionally, there is a "velocity" of monetary transactions factor that is often not considered. It's determined by the number of times a $1 exchanges hands in a business transaction. The slower the velocity of transactions, the lower goes the Gross Domestic Product of the Economy. People saving too much out of fear of, or expectation of future declining prices decreases our GDP. Banks worried that collateral will depreciate below loan value will either require more collateral, or refuse to loan.
Think of the economy and money supply as a wind sock that has to have a constant flow of air through to remain pointed in a horizontal direction. If the wind ebbs, the windsock will go limp..
That's why that Consumer Confidence Number is so danged important. If the consumer is not buying, they aren't taking out loans (decreasing money supply), or spending cash (decreasing velocity). Supply and demand dictate that both must remain in balance. Reduce demand and excess will need to be liquidated at discount prices. The TRUE problem will be when supply is reduced and pent up consumer demand then creates inflationary pressures.
But for now, we're looking at deflationary pressures as the primary threat. Deflation is FAR MORE DIFFICULT TO RESOLVE than inflation is. It's easier to reduce demand by raising rates than it is to increase demand from masses of unemployed and fearful people who've suddenly rediscovered the merits of frugality and living debt free.
I am currently debt free with $$$$ in the bank and my brokerage account.. Are you?
Scrutinizer
Consumer Confidence PLUMMETS 10 points from June report
Consumer Confidence
This is a TERRIBLE REPORT!! It's down almost 10 points from the previous report, which is equivalent to falling off a cliff.
It's ALSO the lowest level for the year, and a full 3 points lower than the PREVIOUS LOW in April. In fact, it's the lowest since August, 2009!!
What will next month's report look like? I suggest it will be even lower.
And if that wasn't bad enough, ECRI economic data has ALSO PLUNGED to within .02% of previous levels that have clearly predicted a recession. That's where the fear of a "double-dip" is gaining ground.. And a DD recession is just a politically correct way of saying "DEPRESSION".
ECRI Growth to -9.8%
It's clear.. "Joe Six Pack" is feeling the pain of prolonged unemployment, loss of unemployment benefits, and increasing foreclosures. Small businesses, who make up a large percentage of the US economy, are not hiring at nearly the rates necessary to bring down unemployment. They are hampered in obtaining credit, while "Big Business" is hoarding cash.
So while we're in the midst of earnings seasons, the market is a forward projecting mechanism. It's all well and good that the last quarter may have been good for profits, but what is Corporate America going to do for an encore?
There's a reason corporations are hoarding cash and why banks are not lending. They see more economic downside in the future and they are preparing their "war chest" in order to survive and take advantage of it.
Banks are hoarding cash so they can appear to be the strongest contender for taking over any insolvent competitors that the FDIC takes down. Why extend risky loans against depreciating collateral to grow their business when they can wait for their insolvent competitors to go belly up and then take over their branch offices as well as all their depositors. They know FDIC will pick up the bad loans.
This is killing small businesss...
As for the market read... I'm short via Ultra-Bear ETFs, and will remain that way for the foreseeable future based upon this plunge in consumer confidence, as well as expectations for even worse in the next report.
And now I'm worried about another "Flash Crash" as well. This market is thinly traded and if no one but the computers are buying stock, we're in serious trouble going forward.
But Goldman Sachs would apparently disagree with me. They assert that the S&P is still going to 1300 by the end of the year. I'm not sure what fundamental data they are basing this on, but it certainly can't be on Consumer Confidence data:
S&P going to 1300?
Feds with nothing better to do than raid private entrepreneurial farms
Here's an article where the government's assault on small business impacts even the small time farmer's markets and small farmers:
Feds raid "food clubs"
Now I don't know about you, but I like raw milk. I used to work at a dairy lab owned by some family friends when I was younger and they would receive raw milk from local dairymen.. It's awesome!! And it's the way our parents, and grandparents drank raw milk prior to homogenizing, and pasteurization. Our forebears also ate free-range chickens as well as their eggs. My Aunt use to have her own hen house and the eggs were always fresh.
I find this rather shocking that Law Enforcement has the resources to conduct these raids on agricultural entrepreneurs, but can't manage to deal with illegal immigration. If some of these clubs are not in compliance with regulations, they should work with them to achieve proper compliance, not conduct these ridiculous and treating them as if they were major crimes.
Scrutinizer
Thursday, July 15, 2010
Markets Ready To Sound Retreat??
A couple of videos regarding the market direction for the next few days. We're clearly getting over-bought. It's just a question of what the event will be that incites the sell-off.
Dan Fitzpatrick's market read
One disturbing aspect for Dan's TA read, is that the channel he indicates as next support is lower than the previous one. That could, potentially, induce the H&S sell-off that has been so expected.
PSA market read
And this very informative article comparing now to the market crash of 1929-1930:
Daryl Guppy's market read
Scrutinizer
Wednesday, July 14, 2010
Will 2011 Capital Gains Tax changes put a nail in the US stock market?
There has been some discussion going around about how the 2011 Capital Gains tax increases will impact market performance into the fall.
Since 2008, individuals in the two lowest tax brackets paid 0 percent long-term capital gains tax while everyone else paid 15 percent. In 2011, individuals in the lowest tax bracket will pay 10 percent while the rest will pay 20 percent.
Additionally, the article goes on to state an interesting strategy that make impact end of year trading choices and make for a nice "January Effect":
One interesting idea for buy-and-hold investors is to sell stock gains at the last possible trading day of 2010 and immediately buy it back in 2011. By doing so, investors can lock in existing gains at a lower capital gains tax rate and still keep the investment.
For example, if the cost basis is $10 and the investor sells it for $20 on the last trading day of 2010, his $10 gain will be taxed at the 2010 rate (which is zero for some lower income individuals). If he immediately buys it back on the first trading day of 2011, he now owns the stock at the new cost basis of $20 (assuming no change in price) and the $10 original gain is forever locked in at the 2010 tax rate.
Capital Gains going up in 2011
Here is a re-post of an interesting chart that was placed in a previous comment (Thanks PPP** for the chart!)
Interesting S&P prediction
Also, I looked at the VIX chart and it's seemingly showing it's ready for a renewed uptrend. Will JP Morgan's earnings tomorrow disappoint?
Daily chart.. insert VXX
I should probably repost an article that discusses JP Morgan's earnings and how it far underperforms what should be expected from a bank with a near trillion dollar balance sheet:
He suggests we not be fooled by recent earnings reports or government stats, pointing to U.S. bank earnings as especially inaccurate. JP Morgan has a balance sheet of $1 trillion and can borrow at essentially zero, he notes. So if they just go out and buy 10-year bonds at 3% they should be able to earn $30 billion a year. Yet the bank announced a profit of $3.3 billion last quarter.
"What does that tell you? It says they are losing money on everything else," Das says. "Strip out the gifts, and it's big net loss." And at big industrial concerns like General Electric, he argues, revenue growth is anemic -- so earnings growth is solely stemming from cost-cutting and layoffs.
Comment on JPM is about 1/2 way into the article
That's about 1/2 of what JPM should be receiving as an annual return were it SOLELY INVESTED in 3% T-bills. Certainly not the sign of a healthy balance sheet.
Anyway.. got some family drama going on right now.. so need to cut this short.. But speaking of "shorts", I'll be looking at re-entering one tomorrow. But again, I'm not yet convinced whether this retracement will lead to the "Big Kahuna".. But review PPP**'s chart and let's see it it prove prophetic.
Scrutinizer
Subscribe to:
Comments (Atom)