M3 is a measure of money supply. The Fed claims they no longer track M3, but many other fundamental analysts and economists still do. Here's a Wiki link to help explain it:
Wiki page on M3 and Money Supply
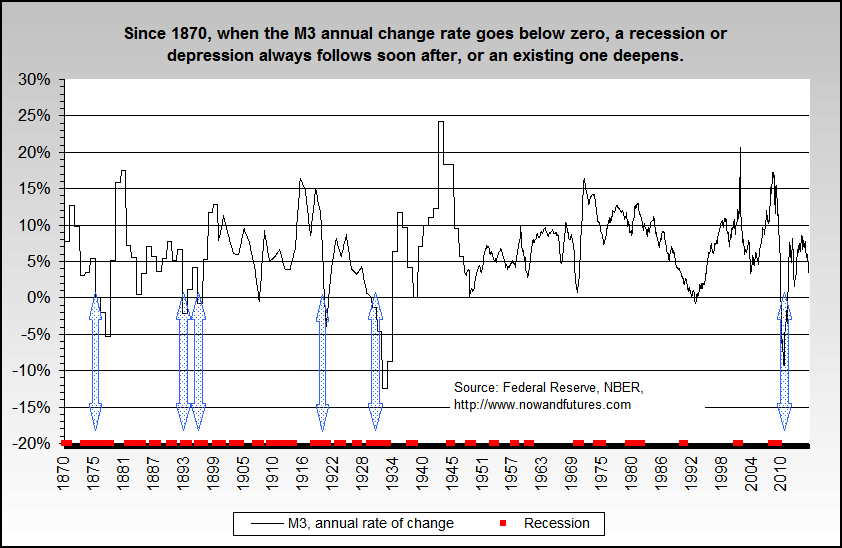
M3 has gone negative this past year. The last time it did that was during the Great Depression Kind of frightening, isn't it?
M3 historical chart
The Fed can foolishly attempt to persuade us that M3 doesn't matter.. But to those who track it, it apparently does.
Russell 2000 (RUT) breaks 50 Week MA.
Mr. Bernanke says we're not going into a "double-dip" recession. I would beg to differ if the charts can be believed.
First off, let me review Parabolic SARs. Simply put, SAR means "Stop and Reverse". When the price of the equity/index penetrates one of these SARs, they "flip" either upward or downward. Flipping an SAR upward means the "dotted line" falls to the last major support level and then starts trending upward. When an equity is declining and penetrates an SAR, the "dotted line" flips up to the last high, which now becomes resistance.
Generally speaking, flipping an SAR upward generates short covering and buying. Consequently, when an SAR flips downward, it generates selling. The longer the time period used in the chart, the stronger the signal.
RUSSELL 2000 Breakdown
The Russell 2000 suffered a major breakdown today. It's last major point of support was the 50 Week Moving Average (MA) and it failed to hold:
RUT Weekly Chart

Additionally, the inverse 3x Bear ETF on the Russell (TZA) also "flipped" it's Daily SAR to an upward bias.
TZA Daily Chart

As some might recall, the TZA "flipped" it's weekly SAR a few weeks back when the RUT crossed under it's 200 WEEK MA, which indicated the index was in distribution. Flipping the TZA Daily SAR was the last bit of resistance (support?) to halting a sell off in the RUT to it's next level of support, found in the Monthly RUT chart:
RUT Monthly chart

The RUT is in serious trouble. The Monthly chart above suggests that the next level of support for the RUT is 581 which is the lower arm of the Monthly Bollinger Band. However, I believe the ultimate target is a test of the Monthly SAR, which is currently located at 487.
If that occurs, then TZA, being a 3x Ultra-Bear ETF on the RUT, could stand to appreciate considerably during this retreat in the RUT to that Monthly support line.
It's been my theory that the Small Cap indices, such as the RUT, would become a source of funds for supporting the S&P 500 and DOW 30. I think we're starting to see this come to fruition.
We can see by the "flipping" of the TZA Daily SAR, that the next point of resistance is TZA's 200 day MA (which, btw, is substantially different than the RUT's 200 Day MA, which was penetrated to the downside a few days ago. To properly reflect it's position as an inverse ETF to the Russell, both should cross their 200 Day MAs at the same time. But this hasn't happened for some time. Possibly RUT longs have been shorting TZA as an arbitrage, thereby skewing the equilibrium between the index and it's inverse ETF.
This suggests that TZA has substantial upside as it attempts to equalize to it's inverse index.
Scrutinizer
I think we need another day or two to confirm RUT break of weekly 50 MA is guaranteed. That's the ugly thing, because by the time we are 100% certain, the worst could be behind us
ReplyDeleteConcur.. but I think it's an inevitability from looking at the the Monthly chart..
ReplyDeleteJust a matter of how long it eventually takes.