Wednesday, June 09, 2010

Is there a Bullish case lurking out there that we're not recognizing?

Came across this article last night regarding the Arms Index reaching an extreme:

ARMS Index at 13.22.

ARMs Index explained


Arms said:


"The value for the day on Friday was extremely high. According to the Wall Street
Journal it was 13.22. They used the following components:Advances 315, Declines
2839, Advancing volume 13,602,600, Declining volume1,621,066,016.I have gone with
this since the numbers I got from other sources were obviously completely erroneous.
Sometimes, as in 1987 particularly, there is a lot of confusion.But watching the numbers
during the day on Friday, I think the WSJ must be close.

That makes this the fourth highest reading in at least the last seventy years, which is as
far as I can go back.
On the chart above I have shown the daily readings going back to
1987, with the horizontal blue line at 10.00 for reference.You will observe that the
extremes such as we saw on Friday seem to come in at bottoms.They represent a sudden
rush for the exits, such that the declining stocks are receiving ten or so times as much
volume as the up stocks.In other words, the crowd mentality has taken over and stocks
are being indiscriminately dumped.It is a sign of fear and panic, and appears, in most
cases, to be misplaced fear, at least on the short to intermediate term."


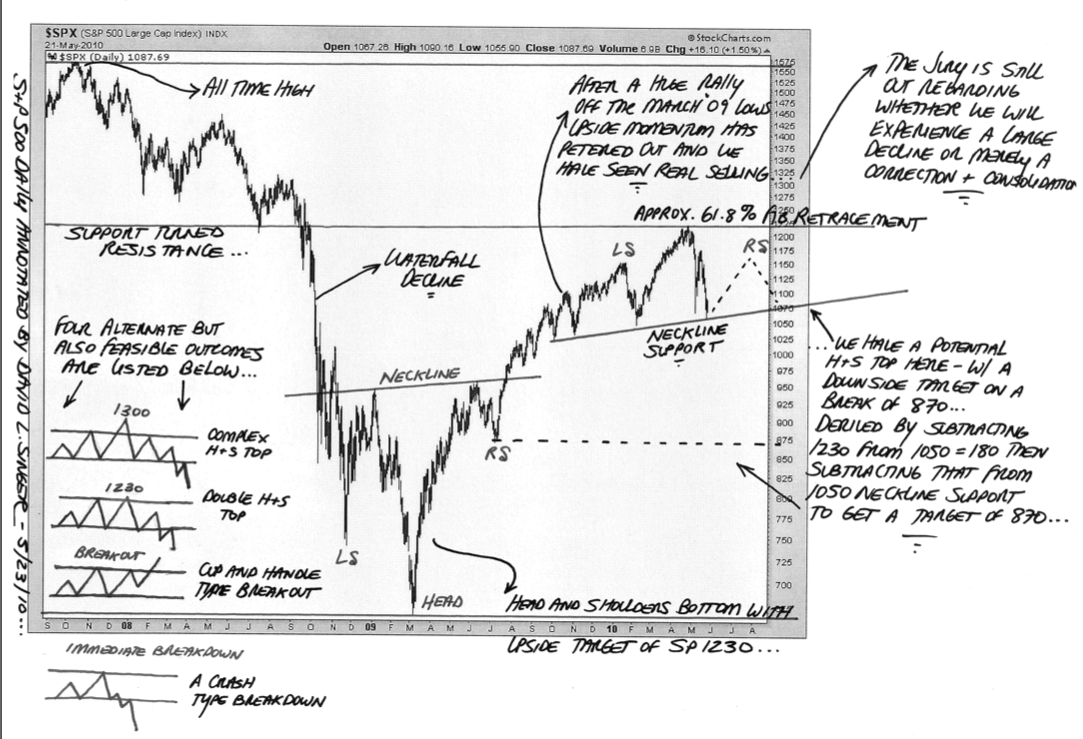
So.. Does that mean we're putting in a short term bottom with a rally towards this year's previous highs, thereby forming the "right shoulder" on H&S many have been seeing being formed, or could it lead to even higher highs, suggesting we're in a new Bull Market?

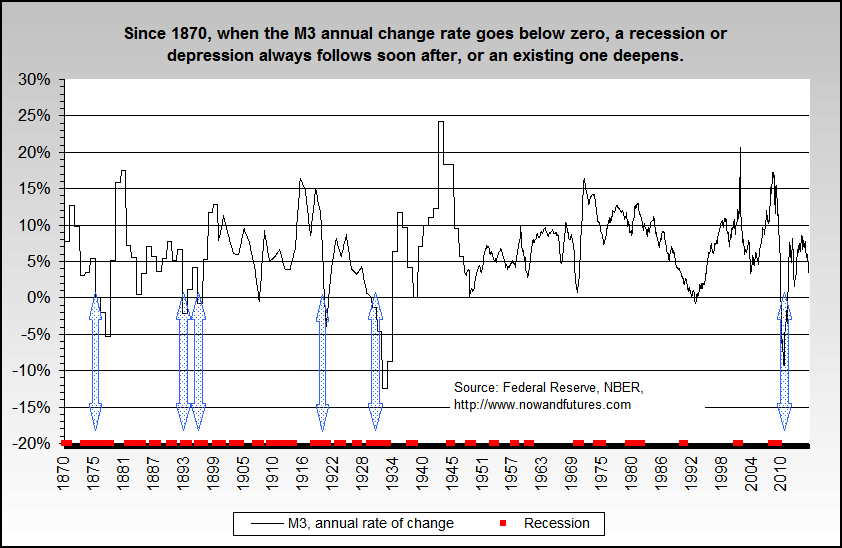
I don't know. As stated in previous posts, I remain overall bearish given M3 and that 10 years "Mother of all H&S" formations I've been seeing. But the reality is that if I can see it, then the Fed and Treasury can see the same thing and might be trying to orchestrate a global effort to break the technical "waterfall" that occurs when those right shoulders collapse below the neckline price.

DOW H&S formation.

We remain in an inflection point in the markets, with a currently bearish bias. But that doesn't mean the rallies can't come fast and sharp back up to critical resistance points. It will be interesting to see how much of that resistance can be overcome.

Which brings to "positive event risk" (for the bears). What lurks out there that could dramatically reverse this market to the upside?

The primary event that might make me turn bullish again, would be firm regulation and control over Credit Default Swaps, which are destroying the Capital markets.

Secondly, would be a concerted jobs program to spur re-hiring in the PRIVATE SECTOR (not public). We need to rebuild the demand curve in this economy and that can only come if we have more private workers than we have public ones. Because extended unemployment benefits are nothing more than a fancy term for Welfare, it would have made more sense subsidizing small business to retain, retrain, and hire workers, if only to avoid people losing job skills.

Certainly Europe stabilizing would be nice.. but I'm not counting on it.

That's about all I can perceive that would change my mind outside of the return of the Messiah.. ;0)

Scrutinizer

Tuesday, June 08, 2010

M3 has gone negative in a BIG way.

M3 is a measure of money supply. The Fed claims they no longer track M3, but many other fundamental analysts and economists still do. Here's a Wiki link to help explain it:

Wiki page on M3 and Money Supply

M3 has gone negative this past year. The last time it did that was during the Great Depression Kind of frightening, isn't it?

M3 historical chart

The Fed can foolishly attempt to persuade us that M3 doesn't matter.. But to those who track it, it apparently does.

Russell 2000 (RUT) breaks 50 Week MA.

Mr. Bernanke says we're not going into a "double-dip" recession. I would beg to differ if the charts can be believed.

First off, let me review Parabolic SARs. Simply put, SAR means "Stop and Reverse". When the price of the equity/index penetrates one of these SARs, they "flip" either upward or downward. Flipping an SAR upward means the "dotted line" falls to the last major support level and then starts trending upward. When an equity is declining and penetrates an SAR, the "dotted line" flips up to the last high, which now becomes resistance.

Generally speaking, flipping an SAR upward generates short covering and buying. Consequently, when an SAR flips downward, it generates selling. The longer the time period used in the chart, the stronger the signal.

RUSSELL 2000 Breakdown

The Russell 2000 suffered a major breakdown today. It's last major point of support was the 50 Week Moving Average (MA) and it failed to hold:

RUT Weekly Chart


Additionally, the inverse 3x Bear ETF on the Russell (TZA) also "flipped" it's Daily SAR to an upward bias.

TZA Daily Chart


As some might recall, the TZA "flipped" it's weekly SAR a few weeks back when the RUT crossed under it's 200 WEEK MA, which indicated the index was in distribution.   Flipping the TZA Daily SAR was the last bit of resistance (support?) to halting a sell off in the RUT to it's next level of support, found in the Monthly RUT chart:

RUT Monthly chart


The RUT is in serious trouble. The Monthly chart above suggests that the next level of support for the RUT is 581 which is the lower arm of the Monthly Bollinger Band. However, I believe the ultimate target is a test of the Monthly SAR, which is currently located at 487.

If that occurs, then TZA, being a 3x Ultra-Bear ETF on the RUT, could stand to appreciate considerably during this retreat in the RUT to that Monthly support line.

It's been my theory that the Small Cap indices, such as the RUT, would become a source of funds for supporting the S&P 500 and DOW 30. I think we're starting to see this come to fruition.

We can see by the "flipping" of the TZA Daily SAR, that the next point of resistance is TZA's 200 day MA (which, btw, is substantially different than the RUT's 200 Day MA, which was penetrated to the downside a few days ago. To properly reflect it's position as an inverse ETF to the Russell, both should cross their 200 Day MAs at the same time. But this hasn't happened for some time. Possibly RUT longs have been shorting TZA as an arbitrage, thereby skewing the equilibrium between the index and it's inverse ETF.

This suggests that TZA has substantial upside as it attempts to equalize to it's inverse index.

Scrutinizer

Sunday, June 06, 2010

BP Billion Dollar engineering at work:

Can ANYONE tell me what's wrong with this picture? :

Live feed from BP valve 5,000 feet down on that well head

Anyone notice the Duck Tape?

Scrutinizer