Why Nancy Pelosi MUST BE VOTED OUT in the next election
Watch this:
Pelosi.. Unemployment Creates Jobs
WashExaminer remarks..
So Nancy would have us believe that extending unemployment benefits "creates jobs"?
First off.. let's call these extended benefits what they are... Welfare. That's right.. Welfare.. Because the regular benefits were actual insurance, with premiums paid by both employers and employees. But they don't want to call it Welfare.. So they call it "extended unemployment benefits"..
Listen up Nancy.. I agree that we need to create jobs. But if you think keeping people on welfare is the way to do it, you're not playing with a full deck.
Why not just use those extended unemployment benefits to pay for a tax credit for small businesses to hire and (re)train those on the unemployment roles? At least these people would be retaining job skills instead of wallowing in self-pity, drinking beer, and playing Xbox.
But that's not the game plan.. Keep people on those "extended benefits" and guess what??.. They're more likely to vote democratic in the next election.
The government has a role in stimulating the economy and stabilizing the job market. After all, this country is about it's people. Political Parties and Corporations exist to SERVE the needs of the people. They are TOOLS for promoting opportunities for prosperity for the people.
If you want to stimulate the economy, cut taxes and cut public sector salaries to parity with the taxpayers that ultimately pay their salary and pensions. It's IMMORAL that public sector workers enjoy greater prosperity than those in the private sector.
That's what is endemically wrong with this economy. Private sector risk taking is inhibited by public sector grifters.
Don't get me wrong.. There are VALID public sector jobs, many of them very dangerous. But for God's sake, we have cops making well over $100K per year in many cities and it's bankrupting the system.
But let's just end this with the understanding that Welfare DOES NOT create jobs to any greater degree than Small Business tax credits that would cost less and KEEP THOSE PEOPLE EMPLOYED IN THE FIRST PLACE.
It's simple.. Taxpayer money spent for stimulative purposes needs to have an Return On Investment (ROI). Infrastructure.. Space Exploration... Creating the Internet, Materials and Energy Science.. etc.
We can't afford Welfare.. But WE CAN PROVIDE WORKFARE, so people retain their dignity, their work ethics, and the taxpayers get something in return.
Scrutinizer
Thursday, July 01, 2010
The Two Faces Of Goldman Sachs
What a great coup for ZeroHedge.. And it shows just how "two-faced" a Big Wall Street firm is when it comes to providing one set of strategies for their "special clients", which is directly opposite of what one of the Vice Presidents, and Top "Analysts" tells the retail customer on CNBS or some other media outlet:
GS Trading Report
Notice the "distribution" list?
Not for distribution to retail investors
But apparently THIS is for distribution to the "retail" J6P investor:
Abby Cohen: Here to pump (and dump) you up..
We think the recovery here in the United States is quite solid. It will not be as fast as we have seen in previous recoveries from recession, when our GDP had grown 8%, but we think we have very solid growth of about 3%, which is dramatically faster than we are seeing in many of the other developed economies.
WHO THE HELL IS "WE"??? The clients (hedge funds, and big money, and maybe even Uncle Sam) who have hired GS to sell their stock positions to a bunch of gullible retail investors, most of whom can't even pay their mortgages and credit cards off, let alone be sure they will have a job in a year.
It's certainly NOT the GS Trading affiliates.
Those guys are seeing the VERY SAME thing I've been discussing for the past month here.
And don't EVEN get me started about Goldman's complicity in the Real Estate Bubble and it's eventual demise, or their role with Credit Default Swaps. And now they want to get those Carbon Credit markets rolling so they can put the screws to America just a bit more.
Scrutinizer
Wednesday, June 30, 2010
Chart Of The Day
The Black Swan Cometh
Btw, ADP jobs data came in especially weak. There was an estimate of 60,000 new jobs and the report only registered 13,000.
The S&P 500 is currently trading under 1040 (@1039 as I type) so apparently there may be little support for the index this morning and that may put us firmly under that critical 1040 H&S "neckline".
Also, European indices started off the morning in the green, but now have turned negative.
Additionally, the only major Asian index in the green was Singapore.
Scrutinizer
Tuesday, June 29, 2010
Descending MA Trifecta Next?
Once in awhile I come across one of those technical indicators that constitute an epiphany in my analysis of the markets. I knew about this one, but somehow it got overshadow by all the other TA noise one hears from day to day.
It's called the MA Trifecta and pertains to what happens when 30, 50, and 200 (Day/Week/Month.. etc) Moving Averages all "roll over" into a declining trend and how reliable of a signal that is.
Descending MA Trifecta
Visit the chart link below and adjust the time frequencies to 5 year, then 10 year, inputting SPX, INDU, RUT, and QQQQ which represent the major indices.
Daily Chart Template
Now use the Weekly, All-data settings and the above symbols. Here's a weekly chart template:
Weekly INDU Chart Template
Also, note that the INDU chart shows the 50 Week MA NEVER made it above the 200 Week MA after the 2008-2009 crash. Now change the settings to "1 year, weekly" and you'll see that the all three averages are declining. That's the "Trifecta" and as you've seen from back testing in the links above, IT'S A POWERFUL INDICATOR THAT IS SELDOM WRONG about the direction of the market.
And the 100 week MA reverifies this trend:
100 Week MA chart template
The only way the MA Trifecta gets busted is normally when the shortest term (30 period) changes direction. And, as always, the longer the time frame (day, week, monthly.. etc) the stronger the signal and the longer it will take to reverse.
And btw, this also works to the upside for identifying UPTRENDS, so it's good to remind oneself and revisit the basics of Technical Analysis.
Ok.. so minus some miracle of positive event related news, it would appear that we're going to continue the downward trend in coming weeks. We have continuing follow through selling in Asia, but not to the same degree as last night. We'll have to see how Europe's markets perform, as well as the Euro and USD ratio. The Euro has resumed its previous decline and that puts upside pressure on the USD (making our goods more expensive to sell overseas).
Furthermore, we saw tremendous buying of US Treasuries, bringing the yields (interest rate they pay) down over 20% on the 10 year bond. That's a sign of panic buying and flight from equities.
Continue to watch the Perfect Stock Alerts (no affiliations between us) market videos.. They're informative, understandable, and entertaining.
Scrutinizer
And The Hammer Falls: S&P 500 breaks below Head and Shoulders Neckline
As I write this, the S&P 500 (SPX) has broken the Head and Shoulders neckline at 1040. It's currently at 1038, which suggests that we're on the way to 900.
Christian at Perfectstockalerts sums it up rather nicely, and has been extremely accurate in his Technical Analysis.
If You're An Idiot, Buy Stocks
To remind you, PSA is predicting a 2100 point loss in the DOW industrials that takes us back to 8000 or so.
PSA predicts 2100 decline in Dow 30
I've tried to warn those friends of mine who are still in the market that this was likely to happen. I'm sad for those who didn't follow the signs.
Now.. to remind all of you, THIS H&S formation currently represents a H&S within a H&S. The major H&S covers a 12 year period originating from the Internet Bubble, to the Real Estate Bubble all time high in 2007, and now the Sovereign Debt Bubble.
Mother Of All Head And Shoulders, Revisited
Now.. it's POSSIBLE that we might see a rally back up to 1060 on the SPX, but the cake has been baked. If we get that rally, you're well advised to sell into it and go to bonds, cash, or for the more daring, go short through the wide variety of Ultra-Short ETFs such as BGZ, TZA, DRV, FAZ.. etc:
Bearish ETF list
But I advise you to wait for a strong rally before indulging in the Ultra-Short sector. These things are notoriously volatile and you'll find you're underwater at times before they gain strength as the market declines continue.
China: The Canary In The Coal Mine
China revisted
China's Leading Economic Indicators were revised downward today and that led to a 4% decline in the Shanghai market. Why this is considered important is that since so many goods come from China to be sold in the US and Europe, if they are producing less, then we're ordering less. Therefore, it provides an interesting signal that analysts watch for signs of future US economic health.
Of course, many also would assert that you can't really believe China's economic data due to governmental controls.
So will this market muster a rally tomorrow? Depends upon the jobs data that will come out tomorrow (from ADP) and on Thursday official Jobless claims. Both of these will come out pre-market, so they could create some additional shocks to the market.
Bloomberg Economic Calendar
Bear in mind that we're seeing a lot of pressure on local and state governments to cull their excess workforce and balance their bloated budgets.
Good luck out there. And remember that RETURN OF CAPITAL IS MORE IMPORTANT THAN RETURN ON CAPITAL.
Scrutinizer
Monday, June 28, 2010
The Next "9/11" Coming To/Across A Border Near You?:
AL Qaida and Hizballah form "alliance" with Latin Dictators and Drug Cartels.
It's been long rumored (at least publicly.. ;0) that there has been an extensive Militant Islamist presence in Latin America. They have been involved in fund raising (organized crime and drug smuggling), money laundering, as well as planning and training missions for their operatives to infiltrate the US.
So today I caught this article in "Homeland Security Today" (see my favorite links) alleging that these various Islamist factions, both Sunni/Salafist and Shi'a, have been forming alliances with many of the vicious Latin gangs like MS-13:
Unholy Trinity?
If you have trouble navigating the article, just click on it and look for arrows for page turning purposes.
Anyhoo.. As I mentioned, US intelligence has long been aware that these groups have been attempting to open transport and infiltration routes into the US. And with the increasing power of Venezuela's Hugo Chavez, that country has become a favorite location for the world's terrorist groups. In 2005, Hugo Chavez appointed Arturo Cubillas Fontan, a leader of the Basque terrorist group, ETA, as Venezuela's "Deputy Director, Ministry for Land and Agriculture, presumably because of his extensive connections to the Colombian Marxist Guerilla group, FARC. And this past March, as the result of information gleaned from captured computer files of a FARC commander, it was learned that Chavez had arranged for ETA and FARC terrorists to attempt the assassination of Colombia's President Uribe:
Captured FARC documents demonstrate Chavez ties to terrorism
Hugo denies all.. Claims damning FARC computer files tampered with.
Most have heard of Chavez's relationship with Iran's government and how they feel about the US:
Chavez and Iranian relations
And more recently, if you haven't been living in a cave, you might have heard about Syria's President, Bashir Assad, making a visit to Venezuela a few days ago:
Chavez and Assad united against "Common Enemies"..
So Chavez believes the US, and the American people, are his enemies? Does that mean a state of war exists, at least unofficially, between Venezuela and the US, as well as Israel? This guy sure knows how to put a lot on his plate... ;0)
Now.. if you've read the HST article above, you've figured out that there is an extensive "cultural acclimatization" presence for Islamist militants in Latin America. They are learning the language and the culture in preparation for infiltrating these "assets" into the US. One would think that would grab major headlines, if not highlight how important the illegal immigration issue is to our National Security. If we don't know who is in our country, then how can we know if they are actually Latin Americans looking for a better life, or Islamist militants staging to commit terrorist acts against the American public?
So why am I addressing this subject today?
Well, it would seem the FBI just put the Habeus Grabbus on 10 Russian Spies from a sleeper network and it seems to be BIG NEWS even though no acts of violence seem evident in their espionage activities.
10 Russian agents arrested
Well. I agree.. it's great that we caught them.
But are we still focusing on "cold war" grudge matches, while we seemingly TOTALLY IGNORE the presence of more violently inclined Islamic Militants entering our unguarded borders and assimilating into the Latin communities? Are we not concerned that they might be financing inner city gang activity, while facilitating narcotics trafficking to destroy the minds and lives of our young people?
Still don't believe it's worth getting upset about? How about this quote from this known Al Qaida recruiter:
Islamist recruiter details use of smuggled biological weapons against US
Pretty scary, eh? This is a guy who's a friend of the Taliban leader, Mullah Omar (who's related by marriage to Usama Bin Ladin).
Therefore, I have to ask.. WHY HASN'T HE BEEN SENT OFF TO COLLECT HIS 72 VIRGINS ALREADY???!!
And why are we paying more attention to Russian spies than to people plotting to obtain and smuggle four pounds of Anthrax across the Mexican border?
We don't have our priorities straight in this country.
Scrutinizer
Sunday, June 27, 2010
Summer of regret, or opportunity?
We continue to await the final direction of this market. The SPX seemed to attempt a defense of 1040 last week by holding around the 1080 level, but it seemed to involve a lot of selling.
SPX daily chart
And when you input "weekly" as the time frame, you'll see that 6 out of the past 9 weeks, including last week, involved more selling than buying. This would seem to be a clear sign of major distribution (selling) into rallies. And even going back to the point where the April was made, we can see that it happened on mediocre buying pressure that was overshadowed by previous, and later, selling. That's not normal and was suggestive of a head-fake rally in April.
And pay particular attention to how many weeks passed in that move up to the April high, and how quickly it moved down (11 weeks to move from 1050 to 1217, while it took 4 weeks to move back down to 1050 FROM 1217). Any move that effectively erases the previous gains in a far shorter time is bearish. (btw, I'm not even counting the "flash crash" low, which would have wiped out all of those gains within a week).
That means that selling pressure is MUCH STRONGER than buying pressure.
Summer Rally or Summer Slump?!
Near term market scenarios
So how do we know which way the market goes? We don't. But I suggest that sometime next week we're going to get a better idea of where it's heading. If it involves an ACTUAL retest of 1040-1050, that could set us up for a summer rally. Break down below it and the SPX is heading towards 950, and then possibly 800.
Again.. I want to be bullish, but I'm not seeing any reason to be at this point. Some tremendous technical damage has been done by the 2008 crash and it's going to take time to work that out, even assuming we don't fall back into a double-dip recession (depression).
Here's some more stuff to digest regarding the ultimate direction of the market:
13 Signs The US Economy Has Hit A Brick Wall.
Why The U.S. Will Never Have A Balanced Budget Again.
And watch what going on with China, and especially the Shanghai markets. It represents actual manufacturing expectations far more than the Hang Seng (Hong Kong) market. It's been losing value consistent for weeks now, and it's down another half a percent this morning.
Shanghai index
Shanghai market chart
Very disturbing reading, wouldn't you say?
Of course, many other countries like Japan and Europe are in the very same boat. But the USD is the global reserve currency and if the investing community loses confidence in it's ability to act as a storehouse of value, we're screwed.
Scrutinizer
Friday, June 25, 2010
DOUBLE DIP RECESSION (DEPRESSION?): Handwriting on the wall?
Latest ECRI economic data revisits 2007 pre-recession levels
Mish's take on the ECRI data
It's pretty damn clear, despite the refusal to admit the reality, that we've re-entered a double dip recession.
The recent unemployment data, exacerbated by the BP disaster, as well as mounting pressures to fire public (state and local) workforces will continue to decrease demand and likely create even more foreclosure risk. And as a previous post demonstrated, we had the lowest New Home Starts data since data started to be recorded (adjusted for population). The stimulus package was wasted paying benefits while providing no return in goods/services to the taxpayer (community service and/or infrastructure improvement). Additionally, bailing out TBTF banks meant they just took the money and invested it in Government debt, the interest for which comes out of taxpayer pockets.
And now we have the additional uncertainty, as well as the failure to deal with Credit Defaults Swaps, created by "FINREG" (Financial Regulatory reform). There is NO DOUBT IN MY MIND that this will add to deflationary pressures as banks come to terms with the new rules and regulations.
Don't get me wrong, we DEFINITELY NEED to regulate this financial casino we have created. Opaque derivatives trading need to be brought into the light of day. We need to limit the equally secret Credit Default Swaps markets to ONLY INSURABLE INTEREST so we don't have people trying to commit financial "arson" by buying insurance on assets they don't even own. (eventually I'll address this further in another post).
And now we have a Tropical Depression heading for the Gulf, which threatens to spew all of that oil up onto the beaches, if not picking it up and flying it inland. Let's face reality.. Two more months of 100K barrels of oil per day is going to most likely wind up impacting the keys and even finding it's way into the Gulf Stream.
And there's always the European uncertainty. But it's possible that, with this renewed interest in necessary, but deflationary, austerity measures, the US will HAVE TO follow suit. If we don't we may find our own currency under attack by the supra-national hedge funds.
I'm really looking for some good news out there.. I REALLY AM!!
If you have some... feel free to comment.
Scrutinizer
Wednesday, June 23, 2010
WORST NEW HOMES SALES SINCE 1981.. IN FACT, IT'S EVEN WORSE!!
US New Home Sales had the biggest drop since 1981.
New Home Sales data
HOWEVER, when adjusted for population, they were actually EVEN WORSE, as a very astute comment below reflects:
Housing starts actually lower than previous 1981 decline
To repeat this person's comments:
1980 USA population: 226.5 million ( ~228 million to approximate 1981)
2010 USA population: 309.2 million
1981: .338/228 = .001482 houses/million peeps or 1.5 houses per 100,000 peeps
2010: .300/309 = .000978 houses/million peeps or 1.0 houses per 100,000 peeps
[So, adjusting for population, this low is fully 33% under the 1981 low...
So.. that housing tax credit was all well and good, but it didn't put a bottom into the home sales market. That means, in order to clear out inventory, prices will have to come down EVEN MORE. And sadly, those folks who bought homes using that tax credit MAY actually find that EVEN THEIR HOMES will soon be under water soon.
Scrutinizer
Tuesday, June 22, 2010
China's market foretelling a Double Dip Recession?
Was perusing some of John Mauldin's postings and came across a guest article where the author posits that China is foretelling that the US is facing a potential Double Dip recession. He asserts that China's market leads the direction of US markets by at least 4 months. This would make sense as US buyers would require at least 1/2 year in "lead time" between goods manufactured in China, which would subsequently be shipped to the US for sale. Thus, China provides an interesting "Canary in the coalmine". This is all the more interesting given China's declaration over the weekend that they would show flexibility in pegging their currency to the USD. Some analysts are asserting they would not do this unless they felt confident about the stability of their economy. But other analysts suggest that China may actually find itself forced to devalue in order to improve the competitive desirability of their exports.
China: The Economic Elephant in the Room?
Figure 1 - Weekly chart of four major market indexes showing the Chinese Shanghai Shenzen Composite peaking along with the rest of them in October 2007 but bottoming well in advance of the others in spite of impressive Chinese economic numbers. So which indicator is right? Chart courtesy of GenesisFT.com.
Pay particular attention to the chart the author provides (as well as the notation below that chart that I posted above) showing the performance of the Shanghai index in comparison to the S&P500, the German DAX, and the Indian "Nifty" market.
For the past year, the Shanghai market has been in decline, having peaked in July, 2009. In comparison, the other 3 indices have continued their uptrend. The author, as I understand his comments, suggests that this would be an indicator that these three indices are due for a substantial pullback if they are resolve the divergence that exists with the Shanghai market.
The author also makes a compelling case that China is "cooking the books" and is in a SUPER-BUBBLE which, when it bursts, will have significant ramifications to global commodity prices.
The last thing the Chinese economy needs is a stronger Yuan, but they are facing tremendous political pressure from the G20 to let their currency appreciate.
Is it any wonder why Chinese officials have been so reluctant to let their currency, the renminbi, appreciate in response from demands from the U.S. and China's other trading partners? If the economy is in a bubble, the last thing it needs is a strengthening currency to exacerbate the problems.
The reader may also will recall my previous posting from Monday discussing the Ponzi Scheme that is Chinese real estate. Putting savings into a home, only to obtain a home equity loan against the appreciated value of the home, only to take the funds and RE-LOAN that money to a Loan Shark, who pays 20-150% interest (presumably charging their borrowers even more) is incredible, if true to the extent this is allegedly happening in Chinese "black markets".
Thus, in sum, if the Shanghai index is an indicator of the future for other global indices, that would suggest at least a 20% drop in the DOW and SPX.
Finally, I would offer this CNBC article by Herb Greenberg, which discusses how many Chinese companies have been engaged in reverse mergers into US corporate shells in order to gain access to US capital. Many American investors/speculators have been buying these up in the belief that the companies behind them have been properly vetted as legitimate companies. This could not be further from the truth as there are almost no mechanisms for legally requiring these Chinese companies to fully disclose, except US securities laws, which are extremely difficult to enforce against a Chinese company, even if it's stock is listed in the US.
Chinese Firms Using 'Back Door' to US Exchanges
Reverse Mergers often involve private US companies attempting to take the "fast track" to public status, avoiding the IPO phase, and the vetting that normally involves. Many of them are of extremely dubious credibility, if little more than scams and frauds, but they are accountable to US securities laws. So if the most common reverse mergers are "sketchy", having an unaccountable Chinese company go public in the US exchanges is potentially the quickest manner in which to lose your entire investment.
Most of all it's indicative of the "con-game" that China is playing against Western investors foolish enough to invest in China's bubblemania.
Scrutinizer
Monday, June 21, 2010
Market Crash Warning?!!
The Chartist at Perfect Stock Alerts has been incessantly warning investors that the current market technicals are warning of a market crash. They have reiterated this warning in tonight's video:
Market Crash Warning?
It will be interesting to see if their predictions come true.
We did start off very strongly this morning, as predicted in my last post. But the market couldn't seem to hold the gains. Despite the fact that the SPX was up 12+ points over Friday's close, it gave all that back, plus an additional 4 points. That's not encouraging and smells strongly of "distribution" (selling into market strength)..
You can also see from the following chart that the market is overbought and ready to turn down.
SPX daily chart
Again.. what has to be watched in that Exponential 100 Week MA currently sitting at about 1103 on the SPX.
SPX with 100 Week MA (note: Bigcharts is not particularly accurate with it's MA plotting. I've confirmed the MA support level on my real-time trading platform).
Now mind you, there are differences in Moving Averages. I use the Exponential MA because it more heavily weights RECENT price data, as opposed to the simple MA which smooths the MA out over all available data. Exponential is supposed to react quicker to current market sentiment:
Exponential MA explained
There are a lot of different ways to use MA's. As previous readers may recall, someone turned me on to the fact that the SPX only infrequently violates it's 100 Week MA and when it does, it's usually a strong buy or sell signal (depending on if it's penetrating up or down through the MA). Over the past 6 months, the S&P has been struggling to make an upside penetration of that 100 Week MA, after the 2009 violation of it. It's been above and below it all throughout the spring, and right now the SPX is precariously close to penetrating back down (again) beneath that 100 Week MA. If it does that, one would think that it would send a powerful signal that it will be going down for a retest of Mar, 2009 lows (or at least back to July, 2009 levels @ SPX 900).
And then the question is how long it will take to regain the 100 Week MA.. It could take months, or even years. Such is the suggestion latent in the video posted above.
Very frightening to think we're looking at a chart formation that was seen once before in 1929, isn't it? If investors aren't intimidated by such a comparison, they have no business being in the markets. Some folks fail to recall that the market highs seen in 1929 were not seen again until 1954. That's correct.. it required 25 years before the market was back at the level it was in 1929. Now.. maybe some of you can wait 25 years, or even 15 years, for the market to return to it's previous highs, but most Baby Boomers can't.
And all along the way down, there are people who are shorting this market, standing to profit at the expense of current investors as the markets decline and stay down. Think about it.. if you shorted the market now @ 10,000 and it follows the '29-32 course, within a few years the DOW will be at 1,000 (10% of current value).
That amounts to a loan you don't have to pay back until 20 years from now.
Again.. I hope that I'm incorrect. I truly do.. But I'm just a small fish trying to get a few scraps from a feeding frenzy of financial sharks. They pumped up all of this bad debt with sub-prime loans and derivatives, making a fortune in the process. And now they are setting themselves up profit again (using Credit Default Swaps) as that bad debt collapses and defaults, destroying the money supply at a rate not seen since the Great Depression.
A relative asked me tonight how money is destroyed and walked her through it. You deposit (loan) money to a bank and they pay you interest. Using the fractional reserve lending standards, the bank can then CREATE MONEY by extending $9 of loans for every $1 in deposits they hold. Therefore, if you deposit $1 million dollars in the bank, that bank can extend $9 Million in loans, thereby increasing the money supply by $9 million. Get it?
And if they are paying you 1-2% on your million dollars, and they are collecting interest on $9 million in loans. So they can still make a lot of money even if a few loans eventually default. And when a loan is repaid, or defaults, it destroys a percentage of that money supply.. Get it?
And if you take your money out of the bank, you've suddenly pulled the rug out from under those $9 million in loans they have outstanding forcing the bank to then borrow from the Fed, or another bank, to make up for the money you withdrew, or their $9 million in loans will be undercapitalized. That's what many banks are doing now. They are borrowing from the Federal Reserve discount window at near 0% interest and then loaning it to the US Government (via US debt from the stimulus) at 3-4%. And for those who still have money in the banks, they are taking your deposits and loaning it to the US Government, which is then taxing you to pay the interest on that government debt.
Simply put, there's just not a lot of private lending taking place. Businesses are deleveraging, paying down debt, or just defaulting on their debt obligations. All of this is CRASHING the money supply and there's not enough government stimulus that can replace the rate at which debt is being extinguished.
Shadowstats Money Supply indicators
And since the financial system, and especially the markets, are like balloons that need a constant flow of monetary "air" to keep them inflated, when there is a reduction in the "air" money flow, the balloon deflates. Simply put, visualize a windsock.. Without a flow of air, it droops. Same with the economy.
So we remain a critical inflection point in the markets and the economy. This is going to resolve within the next few weeks (days?!!) and we'll going to find out which way this market is going to go.
Scrutinizer
Sunday, June 20, 2010
China: Ending the Dollar "Peg"?
China announced this weekend that they would show "flexibility" with regard to pegging the value of the Chinese Yuan to the US Dollar. This peg has been in place since 2007, as financial markets demonstrated turmoil. This, of course, has become a major economic issue as the US policy makers see it as blatant currency manipulation that prevents decreasing the US trade deficit (buying more from China than we sell to them).
So overnight futures markets are taking this as some sorely needed "good news" that could propel future US economic gains. Yet, there has been no change in the exchange rate peg and China has stated publicly that it will not make any moves in permitting it's currency to appreciate, nor can anyone truly expect that they would. Some are predicting that China's currency will actually DEVALUE against the US Dollar, given their dependence upon US and European markets to sell their goods. I have a feeling the Chinese will likely keep any variation very limited so as not to stir of financial chaos as people unwind positions they've held based upon the speculation that China would not de-peg the Yuan from the dollar. And China has stated that such "flexibility" is not going to solve the financial morasse we're ALL in (including China).
Flexible yuan won't rebalance world economy
Given my previous post, and the mounting evidence of China's real estate bubble posing a MAJOR problem, it's likely Bejing might even let their Yuan devalue against more transparent currencies in order to boost the demand for their products. Additionally, China is facing mounting pressures from it's workforce for increases in their salaries. Raise salaries in China by 25% and they will eventually have to devalue their currency to maintain their export competitiveness.
So much for the fundamental picture...
So what does all this mean? Well.. if you're short (as I am to a limited degree), we're going to feel some financial pain tomorrow and possibly into most of next week.
If you're long the market, you have to ask yourself whether this is going to truly make a major difference to the data I've been reporting over the past several weeks. Does this mean a new Bull market is underway, or did you just get handed the chance of a lifetime to sell your holdings into the short-squeeze that may possibly erupt this week? When the squeeze is over, it's likely this market is going to fall hard.
Remember.. if you're long the market, the most you can lose is 100% of your investment (assuming it goes to zero). If you're short, your losses are technically "infinite" if the market never declines. And there are lot of people who are short this market, for very solid fundamental reasons, and there could be a mad scramble to cover their short positions this week. They've all been looking for 1150 on the S&P to be the top of the Right Shoulder of this H&S. SPX 1250 will definitely prove them wrong. Anything lower than that level will either be a H&S right shoulder, or a Double Top of the previous 1200 April, 2010 high.
To repeat.. for those holding stocks (longs), your signal to stay long for a new Bull Market is if the S&P reaches 1250 (11300 Dow). If the market turns down hard before getting to that point, then your sell signal is a close below 1103 on the S&P500 and definitely be out if it gets back to below 1040.
Remember Longs.. for a Head & Shoulders formation to be nullified, it HAS TO MAKE A NEW HIGH on the right shoulder that exceeds by a good percentage, the previous high evidenced by the "Head". Again, that's exceeding at least 11,300 on the DOW and 1250 on the SPX.
SPX chart with 100 Week MA
Now.. here's the kicker.. remember that 12 years DOW chart I posted a few weeks ago?
Mother of all H&S revisited
For THAT long term H&S to be nullified, we need to see the Dow get back to 14,500 level we saw in 2007.
Get ready for the E-ticket ride starting at 9:30 AM tomorrow.
Scrutinizer
Chinese Real Estate: A huge Ponzi scheme?
Found this article this morning and thought it provided an interesting take on the Chinese Real Estate boom. In sum, it would appear that Chinese home owners get a loan against their home, and then loan that money out to "Shark Loan" organizations.
Chinese Real Estate one huge Ponzi scheme?
More later.. Happy Father's day!
Scrutinizer
Friday, June 18, 2010
ECRI Weekly Leading Indicator falls off a cliff
Well.. the market, once again, seems to ignore tremendously bad economic news in it's climb to 1150 on the S&P 500 (which many market technicians suggest will form the peak of the right shoulder of the Head & Shoulders).
Weekly Leading Indicators falling off a cliff
WLI declines 5.7% from last weeks 3.7% + graph
Yesterday we had the Philly Fed Survey coming in significantly lower ("8") than the consensus ("20").. Market shrugged it off like it was irrelevant.
And now we have confirmation from the WLI ACCELERATING IT'S DECLINE week over week.
Yet the market rallies? I don't believe it.. And neither should you. But apparently those "Computers" which are making up 80% of the total trading volume nowadays apparently have been programmed to "buy, buy, buy"..
Even AAPL made a new high today!! They have a huge clamoring for their new phone (which doesn't even have 4g infrastructure available in most areas).. It may wind up soaring over $300, but if the rest of the market's fundamentals fail to follow suit, eventually it will be dragged down by its drowning comrades clinging to it.
This is not going to end well..
So when will it end? Here's one suggestion:
Triple Doji preceded "Black Monday"
2009 Triple Doji example
Scrutinizer
Wednesday, June 16, 2010
DOW Industrials Bull Trap spotted?:
I'm really starting to like visiting Perfectstockalert. The guy who does their charts knows his stuff and he knows how to explain a very complex subject in a manner which people can understand. You'll see the link to their website (free) to the left on my links. You should sign up for their youtube link, as well as the website.. It will keep it free. And no.. I take no compensation, nor do I have personal contact with. I like what they are putting out and if that changes, I'll delink them.
Perfect Stock Alert
Tonight he discussed a possible Bull Trap on the Dow. This is a formation where the Bulls get sucked into buying the market thinking it's getting to a new high. But it's a shallow uptrend and on thin volume that fails to overcome the strength of the shorts. Until the shorts cover, there's nothing to propel the market higher.
The "trigger" that will initiate a short-covering spike up, or a fearful sell-off, is like to be the employment numbers tomorrow. Remember that we also have a quadruple options expiration (quadruple witching is what it's called) on Friday.
Here.. just watch for yourself and make your own mind up:
Bull Trap for the DOW?
They also covered the only ETF I currently hold a position in (and waiting to add to when I see a major shift in market direction).
TZA Ultra-Bear analysis
If the numbers don't come in good tomorrow and we start a sell-off, be prepared for SERIOUS UGLINESS in the markets.
I continue to look for rays of sunshine that might give me reason to be bullish, but their all being overshadowed by the BP oil spill. From my reading that's only likely to get worse, not better. And that potentially means that the entire shoreline of the gulf coast will likely be inundated with oil. Florida ALREADY has serious real estate issues, and Miami is on the brink of bankruptcy. Put waves of oil on it's beaches and coral reef and it will be years before it becomes a tourist location, or draws "snowbirds" in their retirement.
There have been nothing but an abundance of lies surrounding this blown oil well..
BP has lied through their teeth.
It was 5,000 barrels at first, and the big dog and pony show over "top kill", but what they didn't tell you was that it was gushing 60K-100K barrels per day and that the well casing was fractured deep into the sea floor. Capping this well would only cause that intense 7,000 psi torrent to tear into the bore hole and surrounding formation and pop out through fractures in the sea floor. So they have to let it spew and just try to contain and collect as much of the oil as they can.
The only hope for resolving the problem is the relief well, where they are trying to drill several boreholes to intersect the current one. Somewhere I read it's tantamount to shooting a dinner plate from 20 miles away. The technology is good, but do not count on any success anytime soon. They have another 20,000 feet to drill from what I'm reading. That's going to a Xmas gift the entire world will look forward to. But it means that oil is going to spew for another 6 months, at least (IMO).
If you're planning a trip to the Florida keys, or the Caribbean, I would suggest you do it very soon.
EDIT:
Philadelphia Fed Survey comes in SUBSTANTIALLY LOWER than consensus
The employment data was slightly worse than expected, but the real "bell ringer" was the Philly Index coming at a measly "8" instead of the consensus of "20":
Philly Index comes in a 8 instead of consensus of 20
The prior reading was 21, so this is a SIGNIFICANT DOWNWARD TREND and indicates the underlying weakness of business and manufacturing conditions now that the Government stimulus is coming to an end. Again.. we go from 21 to 8 within the space of a few months:
historical Philly Fed Survey
Recall that despite spending over 10% of our GDP on this stimulus, we managed to only obtain a 3% overall GDP gain. So that has the market wondering where GDP growth is going to come from without a new stimulus.
And, of course, we have BP's CEO on the hotseat today and I expect some very hard questioning about exactly how much oil is spewing forth, and the market will extrapolate the future economic and ecological damage that will result.
For now BP will remain a going concern, but I suspect that within a year or two, BP will no longer exist in it's current form. It will be acquired, or declare bankruptcy and it's assets sold off.
Scrutinizer
Monday, June 14, 2010
Bearish Case con't
Better to continue this in a separate post.
More on the technical analysis of the current market:
DOW will go down 2000+ points
The technician in this video provides a COMPELLING logic to his prediction using the Relative Strength Indicator (RSI) and the divergence we're seeing in the markets. To be frank, he definitely "clicked the light" on in my head with that. Do not ignore what he's saying because it's predictable, and can be confirmed by using previous incidences of the occurrence.
Now.. Here are 50 incredible facts that seem to support the Bearish case:
50 incredible facts about the US economy
50 stats in a slide show
Scrutinizer
Sunday, June 13, 2010
Go to Cash, Go directly to Cash.. Do not pass Wall Street.. do not collect $200 dividends from BP!!:
Very interesting article tying in the health of Asian banks to Euro Crisis:
Asia Doom
Scrutinizer
Very interesting article tying in the health of Asian banks to Euro Crisis:
Asia Doom
Scrutinizer
ON THE LAUNCH PAD? OR ON THE EDGE OF THE ABYSS?
It's been extremely difficult to asses the direction of the equity markets. If most of my readers are like myself, they've been torn between "going long", going to cash, or "going short" (either directly shorting, or as I've been toying with, via Ultra-Bear ETFs). It's been extremely difficult to do more than day trade these ETFs as the crosswinds of the market have whipsawed investors).
There are very reasonable cases to be made on both the bearish and bullish side, although I find the bearish case more convincing. So I thought I might review the arguments of both in this post, consolidating and/or reviewing some of the thoughts I've focused on previous posts.
The Bullish Case
The most cogent argument that the Bulls can make is that this market is extremely oversold. Normally this is an effective indicator since it follows the old Baron Von Rothschild adage "Buy when there is blood in the streets".
As I posted earlier, the Arms Index, created by Richard Arms is an indicator of "max panic", where selling outpaces buying, indicating a "flushing" of the marketplace and transfer of shares from weak hands into stronger ones. The index registered the 4th highest level in 70 years, according to Arms:
ARMs Index at 4th highest level in 70 years.
We're seeing negativity everywhere in the markets... We've had the Flash Crash of May 6th (which remains insufficiently explained, IMO) which dropped the DOW 1000 points within 10 minutes. Prominent market analysts are urging their readers to sell stocks, we have the problems in Europe, war drums beating in Korea and the Mid-East, the BP oil catastrophe, and some would suggest the sky is falling. To a contrarian investor, this represents "max fear" and therefore, max opportunity to get in at a market low.
Furthermore, we have Investor's Business Daily, and a number of major investment analysts, including Abby Joseph Cohen of Goldman Sachs, now declaring the market correction is over and a new bull market is beginning:
Dusting off Abby
IBD calls end to correction.
Another argument the bulls use is that US corporations are flush with cash and apparently ready to spend it:
Corporations ready to spend record cash holdings
So what would they spend it on? Productivity enhancing technology, new machinery, communications upgrades, including computers. The question is whether this spending, when it occurs, would lead to an increase in employment. Increasing productivity normally means there is less of a need for hiring workers.
There's also the currency argument. The Euro had been previously threatening to seek parity with the USD. That would greatly impact the competitiveness of US corporations against Europeans exports. It would also likely play havoc with currency swaps. So having the Euro transit back above the 1.20 mark is a positive sign the Bulls are lashing their hopes to.
And finally, there's the technical argument that the S&P 500 has held it's 200 Month MA at approximately 1040. A violation of that level would have likely confirmed this correction was actually a resumption of the 2008 bear market, with new lows to be seen in the future:
SPX monthly chart
In sum.. the Bulls are arguing that the negativity is so great that it's lost all sense of perspective and that creates opportunity to move the markets higher.
That's about the best I can make of the Bullish case at this time.. If there's more, I'll update with an "Edit" comment, so be sure and check in from time to time.
The Bearish Case
Lordie.. where do we begin?
Well.. here's a chart that I found very interesting. It was pointed out to me by another TA analyst on the TZA Yahoo thread:
SPX Weekly chart with 100 Week MA
If one changes the period to "all data" instead of 10 years, it will be clearly seen that there have been VERY FEW INSTANCES where the SPX violated the 100 Week MA without a major decline occurring thereafter. We saw this in 2001 and again in 2008, the first times since the SPX went "parabolic" in 1994, that the 100 Week MA was substantially violated. And each violation has resulted in "lower lows" being seen in the SPX, the last low being seen in March, 2009.
Since that time the SPX has risen roughly 83% until it fell below the 100 Week MA during the Feb correction for two weeks, and then violated it again in the days after the May 6th "Flash Crash", where it's remained for the past 3 weeks.
When I first saw this chart, it struck me as rather important and it seems to confirm the comments I made about Monthly Parabolic SARs "flipping" downward:
SPX Monthly SAR flips downward
As Carl Swenlin of DecisionPoint.com states, "Technical Analysis is a windsock, not a crystal ball." Therefore, one has to be willing to change with the prevailing winds and not seek to fight them.
When one is applying Technical Analysis to the market, it's always wise to find confirmations that support one's theories, not only technical, but fundamental.
SPX Gallery View
On the short term, there is an indication the SPX will rally this week (looking at the PPO on the daily chart indicator a reversal to the upside). However, the weekly remains decidedly bearish and the PnF chart still indicates a target of 925.
Now.. this is an interesting PnF chart. It reflects that the "Bullish Percent for the S&P 500" has reached a trend line that signals "Bear Confirmed":
DOW Bear confirmed on May 7th, 2010:
Bullish Percent DOW (INDU)
S&P 500 Bear confirmed on June 9th, 2010:
Bullish Percent SPX
Nasdaq Bear Confirmed:
Bullish Percent Nasdaq
Bullish Percent Index explained
And now.. we have Barron's telling us to "Call a Bear a Bear":
Call a bear a bear?
And this is a DEFINITE read for those making the Bearish case:
"Wall Street seems to have no concept at all that every bit of growth we've observed over the past year can be traced to government deficit spending, with zero private sector expansion when those deficits are factored out. As I noted last week, if one removes the impact of deficit spending, "the economy has recovered to the point where the year-over-year growth rate since early 2009 now matches the worst performance of any of the 50 years preceding the recent downturn." In effect, Wall Street's is seeing "legs" where the economy is in fact walking on nothing but crutches.
Similarly, it is apalling that Ben Bernanke can say with a straight face that many of the "investments" made by the Fed have been repaid "and some have even made a profit," without immediately noting that the two primary sources of these repayments have been, directly or indirectly, the U.S. Treasury, and savers who are receiving near-zero interest on bank deposit instruments.
If we fail to recognize that the "good news" reported over the past year is due not to a recovery in intrinsic economic activity, but instead to massive government intervention, we risk being blindsided as those synthetic effects gradually erode.
On that point, it is notable that the Economic Cycle Research Institute (ECRI) reported Friday that its Weekly Leading Index has slumped to the lowest level in 44 weeks, and has now gone to a negative reading."
Born on Third Base
More later....
Scrutinizer
Wednesday, June 09, 2010
Is there a Bullish case lurking out there that we're not recognizing?
Came across this article last night regarding the Arms Index reaching an extreme:
ARMS Index at 13.22.
ARMs Index explained

Arms said:
"The value for the day on Friday was extremely high. According to the Wall Street
Journal it was 13.22. They used the following components:Advances 315, Declines
2839, Advancing volume 13,602,600, Declining volume1,621,066,016.I have gone with
this since the numbers I got from other sources were obviously completely erroneous.
Sometimes, as in 1987 particularly, there is a lot of confusion.But watching the numbers
during the day on Friday, I think the WSJ must be close.
That makes this the fourth highest reading in at least the last seventy years, which is as
far as I can go back. On the chart above I have shown the daily readings going back to
1987, with the horizontal blue line at 10.00 for reference.You will observe that the
extremes such as we saw on Friday seem to come in at bottoms.They represent a sudden
rush for the exits, such that the declining stocks are receiving ten or so times as much
volume as the up stocks.In other words, the crowd mentality has taken over and stocks
are being indiscriminately dumped.It is a sign of fear and panic, and appears, in most
cases, to be misplaced fear, at least on the short to intermediate term."
So.. Does that mean we're putting in a short term bottom with a rally towards this year's previous highs, thereby forming the "right shoulder" on H&S many have been seeing being formed, or could it lead to even higher highs, suggesting we're in a new Bull Market?
I don't know. As stated in previous posts, I remain overall bearish given M3 and that 10 years "Mother of all H&S" formations I've been seeing. But the reality is that if I can see it, then the Fed and Treasury can see the same thing and might be trying to orchestrate a global effort to break the technical "waterfall" that occurs when those right shoulders collapse below the neckline price.
DOW H&S formation.
We remain in an inflection point in the markets, with a currently bearish bias. But that doesn't mean the rallies can't come fast and sharp back up to critical resistance points. It will be interesting to see how much of that resistance can be overcome.
Which brings to "positive event risk" (for the bears). What lurks out there that could dramatically reverse this market to the upside?
The primary event that might make me turn bullish again, would be firm regulation and control over Credit Default Swaps, which are destroying the Capital markets.
Secondly, would be a concerted jobs program to spur re-hiring in the PRIVATE SECTOR (not public). We need to rebuild the demand curve in this economy and that can only come if we have more private workers than we have public ones. Because extended unemployment benefits are nothing more than a fancy term for Welfare, it would have made more sense subsidizing small business to retain, retrain, and hire workers, if only to avoid people losing job skills.
Certainly Europe stabilizing would be nice.. but I'm not counting on it.
That's about all I can perceive that would change my mind outside of the return of the Messiah.. ;0)
Scrutinizer
Came across this article last night regarding the Arms Index reaching an extreme:
ARMS Index at 13.22.
ARMs Index explained
Arms said:
"The value for the day on Friday was extremely high. According to the Wall Street
Journal it was 13.22. They used the following components:Advances 315, Declines
2839, Advancing volume 13,602,600, Declining volume1,621,066,016.I have gone with
this since the numbers I got from other sources were obviously completely erroneous.
Sometimes, as in 1987 particularly, there is a lot of confusion.But watching the numbers
during the day on Friday, I think the WSJ must be close.
That makes this the fourth highest reading in at least the last seventy years, which is as
far as I can go back. On the chart above I have shown the daily readings going back to
1987, with the horizontal blue line at 10.00 for reference.You will observe that the
extremes such as we saw on Friday seem to come in at bottoms.They represent a sudden
rush for the exits, such that the declining stocks are receiving ten or so times as much
volume as the up stocks.In other words, the crowd mentality has taken over and stocks
are being indiscriminately dumped.It is a sign of fear and panic, and appears, in most
cases, to be misplaced fear, at least on the short to intermediate term."
So.. Does that mean we're putting in a short term bottom with a rally towards this year's previous highs, thereby forming the "right shoulder" on H&S many have been seeing being formed, or could it lead to even higher highs, suggesting we're in a new Bull Market?
I don't know. As stated in previous posts, I remain overall bearish given M3 and that 10 years "Mother of all H&S" formations I've been seeing. But the reality is that if I can see it, then the Fed and Treasury can see the same thing and might be trying to orchestrate a global effort to break the technical "waterfall" that occurs when those right shoulders collapse below the neckline price.
DOW H&S formation.
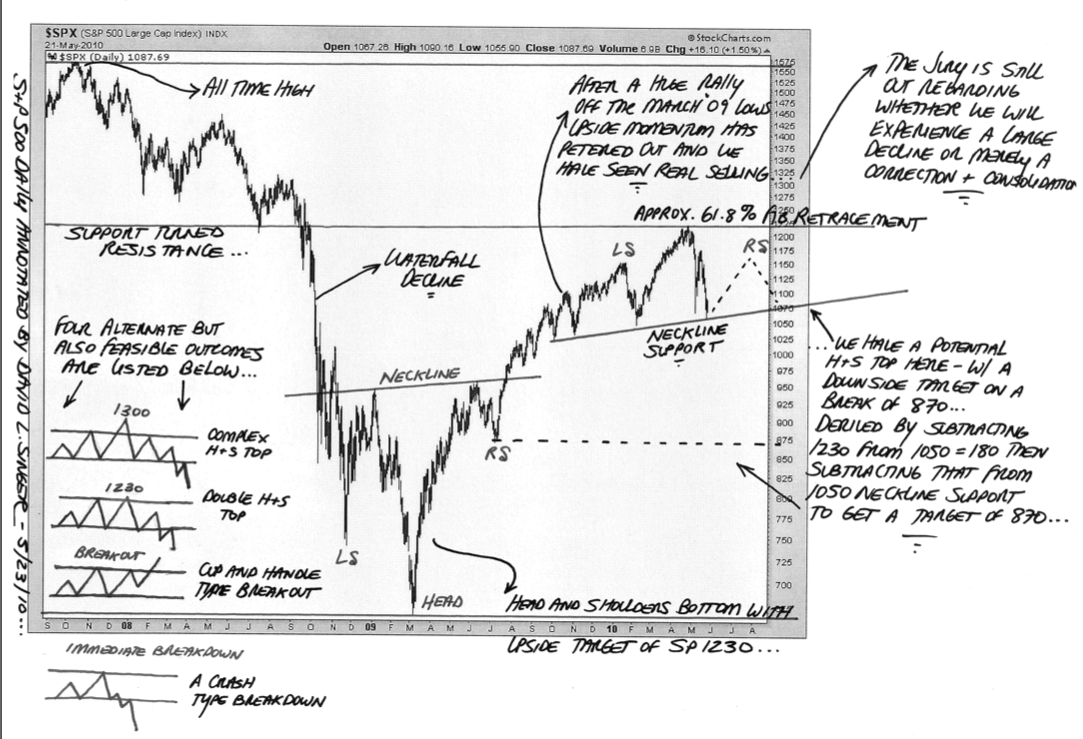
We remain in an inflection point in the markets, with a currently bearish bias. But that doesn't mean the rallies can't come fast and sharp back up to critical resistance points. It will be interesting to see how much of that resistance can be overcome.
Which brings to "positive event risk" (for the bears). What lurks out there that could dramatically reverse this market to the upside?
The primary event that might make me turn bullish again, would be firm regulation and control over Credit Default Swaps, which are destroying the Capital markets.
Secondly, would be a concerted jobs program to spur re-hiring in the PRIVATE SECTOR (not public). We need to rebuild the demand curve in this economy and that can only come if we have more private workers than we have public ones. Because extended unemployment benefits are nothing more than a fancy term for Welfare, it would have made more sense subsidizing small business to retain, retrain, and hire workers, if only to avoid people losing job skills.
Certainly Europe stabilizing would be nice.. but I'm not counting on it.
That's about all I can perceive that would change my mind outside of the return of the Messiah.. ;0)
Scrutinizer
Tuesday, June 08, 2010
M3 has gone negative in a BIG way.
M3 is a measure of money supply. The Fed claims they no longer track M3, but many other fundamental analysts and economists still do. Here's a Wiki link to help explain it:
Wiki page on M3 and Money Supply
M3 has gone negative this past year. The last time it did that was during the Great Depression Kind of frightening, isn't it?
M3 historical chart
The Fed can foolishly attempt to persuade us that M3 doesn't matter.. But to those who track it, it apparently does.
Russell 2000 (RUT) breaks 50 Week MA.
Mr. Bernanke says we're not going into a "double-dip" recession. I would beg to differ if the charts can be believed.
First off, let me review Parabolic SARs. Simply put, SAR means "Stop and Reverse". When the price of the equity/index penetrates one of these SARs, they "flip" either upward or downward. Flipping an SAR upward means the "dotted line" falls to the last major support level and then starts trending upward. When an equity is declining and penetrates an SAR, the "dotted line" flips up to the last high, which now becomes resistance.
Generally speaking, flipping an SAR upward generates short covering and buying. Consequently, when an SAR flips downward, it generates selling. The longer the time period used in the chart, the stronger the signal.
RUSSELL 2000 Breakdown
The Russell 2000 suffered a major breakdown today. It's last major point of support was the 50 Week Moving Average (MA) and it failed to hold:
RUT Weekly Chart

Additionally, the inverse 3x Bear ETF on the Russell (TZA) also "flipped" it's Daily SAR to an upward bias.
TZA Daily Chart

As some might recall, the TZA "flipped" it's weekly SAR a few weeks back when the RUT crossed under it's 200 WEEK MA, which indicated the index was in distribution. Flipping the TZA Daily SAR was the last bit of resistance (support?) to halting a sell off in the RUT to it's next level of support, found in the Monthly RUT chart:
RUT Monthly chart

The RUT is in serious trouble. The Monthly chart above suggests that the next level of support for the RUT is 581 which is the lower arm of the Monthly Bollinger Band. However, I believe the ultimate target is a test of the Monthly SAR, which is currently located at 487.
If that occurs, then TZA, being a 3x Ultra-Bear ETF on the RUT, could stand to appreciate considerably during this retreat in the RUT to that Monthly support line.
It's been my theory that the Small Cap indices, such as the RUT, would become a source of funds for supporting the S&P 500 and DOW 30. I think we're starting to see this come to fruition.
We can see by the "flipping" of the TZA Daily SAR, that the next point of resistance is TZA's 200 day MA (which, btw, is substantially different than the RUT's 200 Day MA, which was penetrated to the downside a few days ago. To properly reflect it's position as an inverse ETF to the Russell, both should cross their 200 Day MAs at the same time. But this hasn't happened for some time. Possibly RUT longs have been shorting TZA as an arbitrage, thereby skewing the equilibrium between the index and it's inverse ETF.
This suggests that TZA has substantial upside as it attempts to equalize to it's inverse index.
Scrutinizer
M3 is a measure of money supply. The Fed claims they no longer track M3, but many other fundamental analysts and economists still do. Here's a Wiki link to help explain it:
Wiki page on M3 and Money Supply
M3 has gone negative this past year. The last time it did that was during the Great Depression Kind of frightening, isn't it?
M3 historical chart
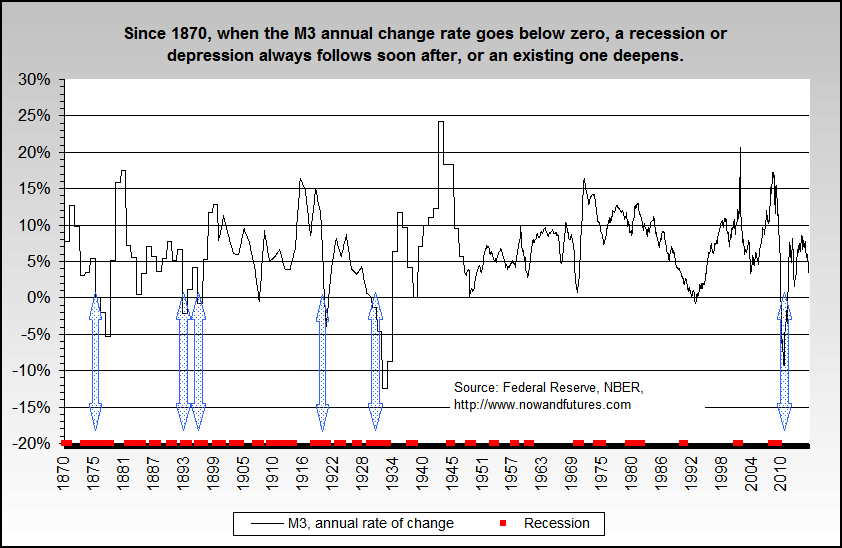
The Fed can foolishly attempt to persuade us that M3 doesn't matter.. But to those who track it, it apparently does.
Russell 2000 (RUT) breaks 50 Week MA.
Mr. Bernanke says we're not going into a "double-dip" recession. I would beg to differ if the charts can be believed.
First off, let me review Parabolic SARs. Simply put, SAR means "Stop and Reverse". When the price of the equity/index penetrates one of these SARs, they "flip" either upward or downward. Flipping an SAR upward means the "dotted line" falls to the last major support level and then starts trending upward. When an equity is declining and penetrates an SAR, the "dotted line" flips up to the last high, which now becomes resistance.
Generally speaking, flipping an SAR upward generates short covering and buying. Consequently, when an SAR flips downward, it generates selling. The longer the time period used in the chart, the stronger the signal.
RUSSELL 2000 Breakdown
The Russell 2000 suffered a major breakdown today. It's last major point of support was the 50 Week Moving Average (MA) and it failed to hold:
RUT Weekly Chart

Additionally, the inverse 3x Bear ETF on the Russell (TZA) also "flipped" it's Daily SAR to an upward bias.
TZA Daily Chart

As some might recall, the TZA "flipped" it's weekly SAR a few weeks back when the RUT crossed under it's 200 WEEK MA, which indicated the index was in distribution. Flipping the TZA Daily SAR was the last bit of resistance (support?) to halting a sell off in the RUT to it's next level of support, found in the Monthly RUT chart:
RUT Monthly chart

The RUT is in serious trouble. The Monthly chart above suggests that the next level of support for the RUT is 581 which is the lower arm of the Monthly Bollinger Band. However, I believe the ultimate target is a test of the Monthly SAR, which is currently located at 487.
If that occurs, then TZA, being a 3x Ultra-Bear ETF on the RUT, could stand to appreciate considerably during this retreat in the RUT to that Monthly support line.
It's been my theory that the Small Cap indices, such as the RUT, would become a source of funds for supporting the S&P 500 and DOW 30. I think we're starting to see this come to fruition.
We can see by the "flipping" of the TZA Daily SAR, that the next point of resistance is TZA's 200 day MA (which, btw, is substantially different than the RUT's 200 Day MA, which was penetrated to the downside a few days ago. To properly reflect it's position as an inverse ETF to the Russell, both should cross their 200 Day MAs at the same time. But this hasn't happened for some time. Possibly RUT longs have been shorting TZA as an arbitrage, thereby skewing the equilibrium between the index and it's inverse ETF.
This suggests that TZA has substantial upside as it attempts to equalize to it's inverse index.
Scrutinizer
Subscribe to:
Posts (Atom)