Been about a year since I've blogged.. Things have been hectic and full of family crisis..
I've decided that I need to post this chart for everyone to ponder. It involved a chart formation that Technical Analysts refer to as a "Head & Shoulders" formation. It's EXTREMELY BEARISH if it resolves to the downside.
Here's the chart:
Mother of All Head & Shoulders
One must recall that while this chart covers from the 1960 to present, the most important portion to review is the past 11 years from the popping of the internet stocks, through 2008 and the popping of the real estate bubble, to present day, where "event risk" is in all the headlines. This event risk can range from the breakup of the EU to potential conflict on the Korean peninsula or mid-east.
In understanding H&S formations, there is a left shoulder (formed in 2000), the head (formed in 2007), and now the right shoulder (formed over the past 2 years).
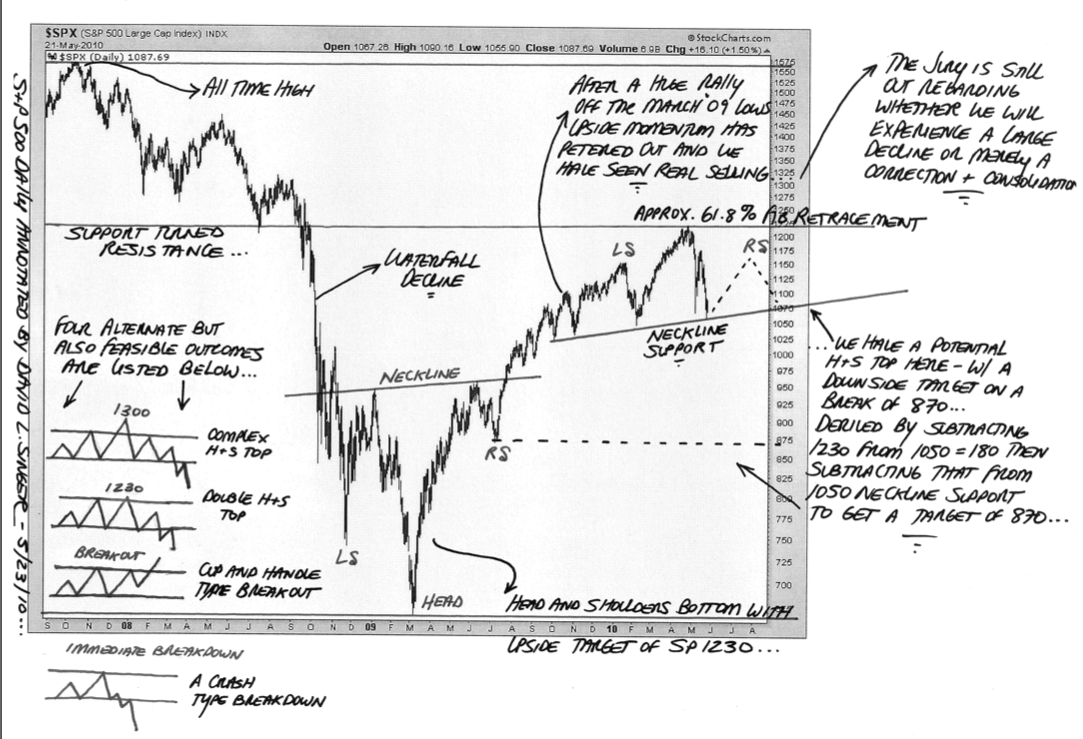
David Singer pointed out this H&S formation and potential implications in the following chart. Pay particular attention to the potential scenarios he draws out at the bottom left of this chart. Note that he is describing a "minor" H&S potentially forming within the time range of 2008 to present, while the chart I show above is over 11 years:
Anyone got a parachute?
And another market analyst who sees the same thing and posts his opinion on the DOW, as well as many other critical charts important to future economic growth:
Even more frightening charts
Now for those who have paid attention, they will recall that in 2000 Microsoft (MSFT) was the largest cap stock in the Nasdaq and that marked the top of the "left shoulder". Right now Apple (AAPL) has surpassed MSFT's market cap for the first time and it's my belief that it will determine when (or if) that right shoulder manifests itself. I see that there was a upgrade for AAPL today that puts a target on the stock well over $300 (currently $264 as I type this). A new high in AAPL, or breaching of the Weekly Parabolic SAR at $267-268, could provide a respite to the downturn. It's a critical price level I'm watching.
Additionally, we had the "Flash Crash" where the DOW dropped 1000 points in under 15 minutes. We still have no explanation for that event. I suspect that it reflects the fact that more and more investing is computerized and when the computers shut down (especially those conducting "High Frequency Trading") it pugs the rug out from under the market. I don't see anything that prevents another repeat of such an event.
Does that make you want to go long in this market?
The implications are clear.. We're at an inflection point in the American stock markets that we haven't seen since the 1930's. If this market resolves into a H&S formation, the consequences (and price declines) will be incredibly severe. Support on this chart is not likely until DOW 3,000.
Now.. many readers might question and say.. "Hey Scrut.... Most US companies have posted better than expected earnings this past quarter.. so how can the markets go down??!!!"
Listen.. we had a Trillion $$ DIRECT STIMULUS package, almost 10% of US GDP, that has only yielded 3% economic growth. That's a 3:1 ratio of taxpayer funded debt to generate 3% economic growth.
JPM has a balance of almost $1 Trillions, yet could only obtain 3 Billion in profit:
"JP Morgan has a balance sheet of $1 trillion and can borrow at essentially zero, he notes. So if they just go out and buy 10-year bonds at 3% they should be able to earn $30 billion a year. Yet the bank announced a profit of $3.3 billion last quarter."
How to make $3 Billion on a Trillion dollar portfolio (scroll halfway down)
Furthermore, commodities are no safe haven (beware gold bugs):
Commodities Con
Richard Russell, noted student/teacher of the Dow Theory has issued a dire warning of impending collapse (and he has considerable credibility).
Hard Rain a'coming!!
What we're seeing is deflationary pressures and de-leveraging. A world gone crazy and extremely vulnerable to event risk. M3 money supply contracted at rates not seen since the 1930's.
M3 money supply contracts at 1930's pace
That's people paying off, and/or defaulting on debt. Debt that is erased equates to destruction of money supply. Destruction of money supply that exceeds creation of new money (via new interest bearing debt) is deflationary.
Most importantly, the speculation in unregulated "naked" Credit Default Swaps is creating a domino effect where asset prices are being undermined by "non-insurable interests". That's a fancy way of saying that your neighbor can speculate that your house will burn down, buy an insurance policy against such an event, and the proceed to perpetrate arson against your home in hopes they can collect on that insurance.
Why would any company, or nation for that matter, want to issue new debt under such conditions? Without regulation of the CDS markets, there is no incentive take on risk to create economic growth. That's incredibly deflationary.
Therefore I'm recommending either people move to cash, bonds, or "Bearish" ETFs (though not without their own inherent risk given that several ultra-bear ETFs were just as affected by the "Flash Crash" as the long ETFs).
Bearish ETF list
I'll try and post more often now.. We're at a very critical inflection point in our markets, IMO.. And I'm advising all my friends to get defensive until we see clear signs of a buy signal. One of the means I use to assess that is using Parabolic SARs as a TA indicator. I'll try to speak more on that in a future post.
Scrutinizer
No comments:
Post a Comment