Turmoil in the Euro, which closed below 1.20 to the USD for the first time in 4 years. Hungary suggesting that debt default is not out beyond exaggeration. Continuing tensions on the Korean Peninsula. AND, OF COURSE, the lousy jobs report where only 20,000 private sector jobs were created in May.. The list goes on for reasons to sell this market.
I ran the Hourly chart on both the S&P 500 (SPX) and the Russell 2000 (RUT) and discovered that the 30 Hour Moving Average (MA) has crossed under the 50 Hour MA. The previous two instances where this occurred resulted in nearly 100 point losses on both indices before they bottomed.
SPX Hourly chart:

RUT Hourly Chart:
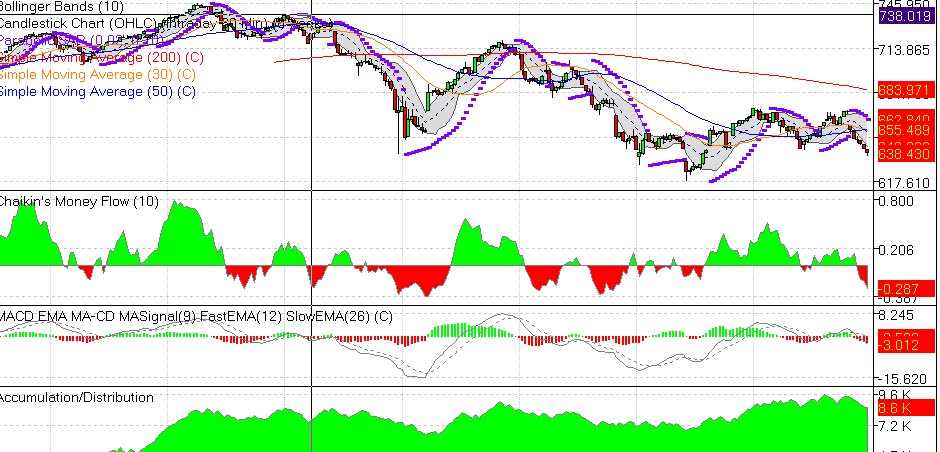
Follow the yellow line (30 Hour MA) as it crosses below the 50 Hour MA (blue line).
Very frightening, eh?
But it's possible that we may see a relief rally that takes us back up to that 30 Hour MA. That would likely be the time to sell or short, and look for a bottom. For the RUT, that short-term bottom may occur at RUT 570.
Scrutinizer
No comments:
Post a Comment