Why the developed world's worst performing economy has such a strong currency
A good friend of mine, who lives in Japan, was commenting on how the Yen had appreciated against the USD in recent months.
No yearning for Yen?
Thought it was very interesting that the "curse" of not having a widely held currency equates to strengthening of such. While the US and Europe are waging "currency wars", with China trying to disentangle itself from the USD peg), the Yen is reacting to internal dynamics. A stronger currency often translates into a lower equity market (the value of each gets priced in stronger currency and therefore "deflates").
Here's another article from ZeroHedge that discusses Japan's mounting national debt and what it means for Western investors, as well as Japanese savers.
Japan: Land of the Rising Debt
As for today's market action, it was a complete "whipsaw" that shocked even myself. I'm seeing a lot of chatter tonight amongst bulls and bears about what the significance of today's action means for the rest of the week and thereafter.
Here's an interesting discussion that I thought put it into perspective, given the lack of volume to suggest a new bullish phase:
Rally at highs sets up reversal
And, of course, Christian from PSA remains bearish on the overall trend of the markets, and especially makes a point about the light volume. But he does admit that we may be looking at a short-term bounce (which he says we should short):
It's just a bounce, stay short
And Daryl Guppy gives us an interesting read on the currency fluctuations in the USD, which likely had a lot to do with today's rally. He believes the recent sharp downward move is nearing a bottom (which likely means the Euro is nearing a top) and that could put pressure on the US equity markets.
USD finding support @ .82
Now.. I'm extrapolating the stock market possibilities from Daryl's comments.
Now.. put on your tinfoil hats and get ready for some true "Rod Serling" material:
TZ theme
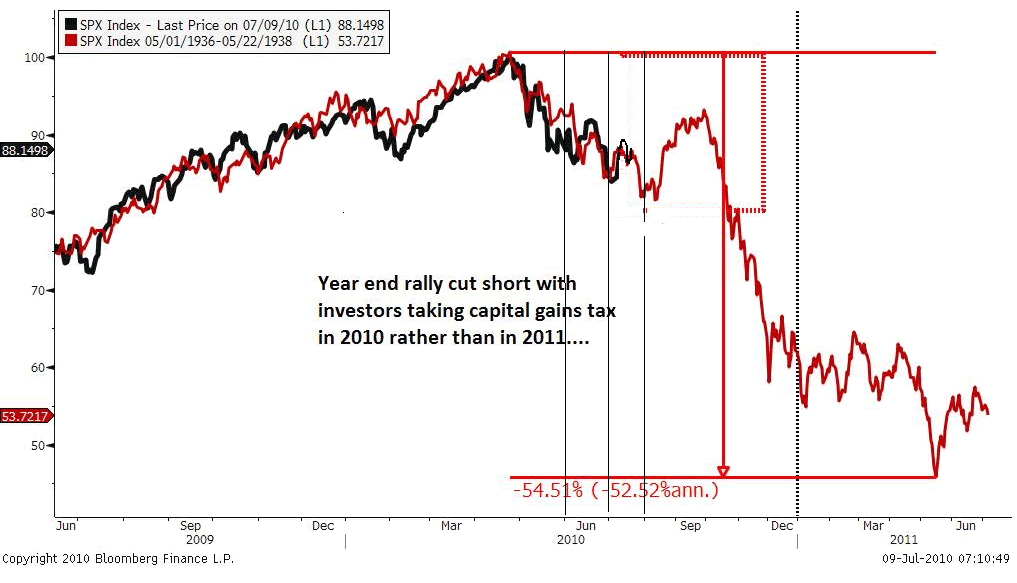
I have a follower, and participant on the Yahoo TZA thread you has posted this incredibly interesting chart that compares the market movements of the current S&P 500 to that of May, 1936. It's DOWNRIGHT UNCANNY how closely it's followed that period:
S&P 500, today and "yesteryear"
Now I have NO EXPLANATION for this occurrence, which would make any Conspiracy Theorist literally drool over the irony. It's almost like someone's plug in the 1936 market program into the High Frequency Trading computers to create a near perfect emulation. Now I don't seriously recommend that anyone use this as a trading guide, but it certainly is one of those "things that make you go hmmm... "... ;0)
Hang tough traders.. Tomorrow will be an interesting day.. Watch China and Europe for clues.
Scrutinizer
No comments:
Post a Comment