ECRI Weekly Leading Indicator falls off a cliff
Well.. the market, once again, seems to ignore tremendously bad economic news in it's climb to 1150 on the S&P 500 (which many market technicians suggest will form the peak of the right shoulder of the Head & Shoulders).
Weekly Leading Indicators falling off a cliff
WLI declines 5.7% from last weeks 3.7% + graph
Yesterday we had the Philly Fed Survey coming in significantly lower ("8") than the consensus ("20").. Market shrugged it off like it was irrelevant.
And now we have confirmation from the WLI ACCELERATING IT'S DECLINE week over week.
Yet the market rallies? I don't believe it.. And neither should you. But apparently those "Computers" which are making up 80% of the total trading volume nowadays apparently have been programmed to "buy, buy, buy"..
Even AAPL made a new high today!! They have a huge clamoring for their new phone (which doesn't even have 4g infrastructure available in most areas).. It may wind up soaring over $300, but if the rest of the market's fundamentals fail to follow suit, eventually it will be dragged down by its drowning comrades clinging to it.
This is not going to end well..
So when will it end? Here's one suggestion:
Triple Doji preceded "Black Monday"
2009 Triple Doji example
Scrutinizer
Friday, June 18, 2010
Wednesday, June 16, 2010
DOW Industrials Bull Trap spotted?:
I'm really starting to like visiting Perfectstockalert. The guy who does their charts knows his stuff and he knows how to explain a very complex subject in a manner which people can understand. You'll see the link to their website (free) to the left on my links. You should sign up for their youtube link, as well as the website.. It will keep it free. And no.. I take no compensation, nor do I have personal contact with. I like what they are putting out and if that changes, I'll delink them.
Perfect Stock Alert
Tonight he discussed a possible Bull Trap on the Dow. This is a formation where the Bulls get sucked into buying the market thinking it's getting to a new high. But it's a shallow uptrend and on thin volume that fails to overcome the strength of the shorts. Until the shorts cover, there's nothing to propel the market higher.
The "trigger" that will initiate a short-covering spike up, or a fearful sell-off, is like to be the employment numbers tomorrow. Remember that we also have a quadruple options expiration (quadruple witching is what it's called) on Friday.
Here.. just watch for yourself and make your own mind up:
Bull Trap for the DOW?
They also covered the only ETF I currently hold a position in (and waiting to add to when I see a major shift in market direction).
TZA Ultra-Bear analysis
If the numbers don't come in good tomorrow and we start a sell-off, be prepared for SERIOUS UGLINESS in the markets.
I continue to look for rays of sunshine that might give me reason to be bullish, but their all being overshadowed by the BP oil spill. From my reading that's only likely to get worse, not better. And that potentially means that the entire shoreline of the gulf coast will likely be inundated with oil. Florida ALREADY has serious real estate issues, and Miami is on the brink of bankruptcy. Put waves of oil on it's beaches and coral reef and it will be years before it becomes a tourist location, or draws "snowbirds" in their retirement.
There have been nothing but an abundance of lies surrounding this blown oil well..
BP has lied through their teeth.
It was 5,000 barrels at first, and the big dog and pony show over "top kill", but what they didn't tell you was that it was gushing 60K-100K barrels per day and that the well casing was fractured deep into the sea floor. Capping this well would only cause that intense 7,000 psi torrent to tear into the bore hole and surrounding formation and pop out through fractures in the sea floor. So they have to let it spew and just try to contain and collect as much of the oil as they can.
The only hope for resolving the problem is the relief well, where they are trying to drill several boreholes to intersect the current one. Somewhere I read it's tantamount to shooting a dinner plate from 20 miles away. The technology is good, but do not count on any success anytime soon. They have another 20,000 feet to drill from what I'm reading. That's going to a Xmas gift the entire world will look forward to. But it means that oil is going to spew for another 6 months, at least (IMO).
If you're planning a trip to the Florida keys, or the Caribbean, I would suggest you do it very soon.
EDIT:
Philadelphia Fed Survey comes in SUBSTANTIALLY LOWER than consensus
The employment data was slightly worse than expected, but the real "bell ringer" was the Philly Index coming at a measly "8" instead of the consensus of "20":
Philly Index comes in a 8 instead of consensus of 20
The prior reading was 21, so this is a SIGNIFICANT DOWNWARD TREND and indicates the underlying weakness of business and manufacturing conditions now that the Government stimulus is coming to an end. Again.. we go from 21 to 8 within the space of a few months:
historical Philly Fed Survey
Recall that despite spending over 10% of our GDP on this stimulus, we managed to only obtain a 3% overall GDP gain. So that has the market wondering where GDP growth is going to come from without a new stimulus.
And, of course, we have BP's CEO on the hotseat today and I expect some very hard questioning about exactly how much oil is spewing forth, and the market will extrapolate the future economic and ecological damage that will result.
For now BP will remain a going concern, but I suspect that within a year or two, BP will no longer exist in it's current form. It will be acquired, or declare bankruptcy and it's assets sold off.
Scrutinizer
Monday, June 14, 2010
Bearish Case con't
Better to continue this in a separate post.
More on the technical analysis of the current market:
DOW will go down 2000+ points
The technician in this video provides a COMPELLING logic to his prediction using the Relative Strength Indicator (RSI) and the divergence we're seeing in the markets. To be frank, he definitely "clicked the light" on in my head with that. Do not ignore what he's saying because it's predictable, and can be confirmed by using previous incidences of the occurrence.
Now.. Here are 50 incredible facts that seem to support the Bearish case:
50 incredible facts about the US economy
50 stats in a slide show
Scrutinizer
Sunday, June 13, 2010
Go to Cash, Go directly to Cash.. Do not pass Wall Street.. do not collect $200 dividends from BP!!:
Very interesting article tying in the health of Asian banks to Euro Crisis:
Asia Doom
Scrutinizer
Very interesting article tying in the health of Asian banks to Euro Crisis:
Asia Doom
Scrutinizer
ON THE LAUNCH PAD? OR ON THE EDGE OF THE ABYSS?
It's been extremely difficult to asses the direction of the equity markets. If most of my readers are like myself, they've been torn between "going long", going to cash, or "going short" (either directly shorting, or as I've been toying with, via Ultra-Bear ETFs). It's been extremely difficult to do more than day trade these ETFs as the crosswinds of the market have whipsawed investors).
There are very reasonable cases to be made on both the bearish and bullish side, although I find the bearish case more convincing. So I thought I might review the arguments of both in this post, consolidating and/or reviewing some of the thoughts I've focused on previous posts.
The Bullish Case
The most cogent argument that the Bulls can make is that this market is extremely oversold. Normally this is an effective indicator since it follows the old Baron Von Rothschild adage "Buy when there is blood in the streets".
As I posted earlier, the Arms Index, created by Richard Arms is an indicator of "max panic", where selling outpaces buying, indicating a "flushing" of the marketplace and transfer of shares from weak hands into stronger ones. The index registered the 4th highest level in 70 years, according to Arms:
ARMs Index at 4th highest level in 70 years.
We're seeing negativity everywhere in the markets... We've had the Flash Crash of May 6th (which remains insufficiently explained, IMO) which dropped the DOW 1000 points within 10 minutes. Prominent market analysts are urging their readers to sell stocks, we have the problems in Europe, war drums beating in Korea and the Mid-East, the BP oil catastrophe, and some would suggest the sky is falling. To a contrarian investor, this represents "max fear" and therefore, max opportunity to get in at a market low.
Furthermore, we have Investor's Business Daily, and a number of major investment analysts, including Abby Joseph Cohen of Goldman Sachs, now declaring the market correction is over and a new bull market is beginning:
Dusting off Abby
IBD calls end to correction.
Another argument the bulls use is that US corporations are flush with cash and apparently ready to spend it:
Corporations ready to spend record cash holdings
So what would they spend it on? Productivity enhancing technology, new machinery, communications upgrades, including computers. The question is whether this spending, when it occurs, would lead to an increase in employment. Increasing productivity normally means there is less of a need for hiring workers.
There's also the currency argument. The Euro had been previously threatening to seek parity with the USD. That would greatly impact the competitiveness of US corporations against Europeans exports. It would also likely play havoc with currency swaps. So having the Euro transit back above the 1.20 mark is a positive sign the Bulls are lashing their hopes to.
And finally, there's the technical argument that the S&P 500 has held it's 200 Month MA at approximately 1040. A violation of that level would have likely confirmed this correction was actually a resumption of the 2008 bear market, with new lows to be seen in the future:
SPX monthly chart
In sum.. the Bulls are arguing that the negativity is so great that it's lost all sense of perspective and that creates opportunity to move the markets higher.
That's about the best I can make of the Bullish case at this time.. If there's more, I'll update with an "Edit" comment, so be sure and check in from time to time.
The Bearish Case
Lordie.. where do we begin?
Well.. here's a chart that I found very interesting. It was pointed out to me by another TA analyst on the TZA Yahoo thread:
SPX Weekly chart with 100 Week MA
If one changes the period to "all data" instead of 10 years, it will be clearly seen that there have been VERY FEW INSTANCES where the SPX violated the 100 Week MA without a major decline occurring thereafter. We saw this in 2001 and again in 2008, the first times since the SPX went "parabolic" in 1994, that the 100 Week MA was substantially violated. And each violation has resulted in "lower lows" being seen in the SPX, the last low being seen in March, 2009.
Since that time the SPX has risen roughly 83% until it fell below the 100 Week MA during the Feb correction for two weeks, and then violated it again in the days after the May 6th "Flash Crash", where it's remained for the past 3 weeks.
When I first saw this chart, it struck me as rather important and it seems to confirm the comments I made about Monthly Parabolic SARs "flipping" downward:
SPX Monthly SAR flips downward
As Carl Swenlin of DecisionPoint.com states, "Technical Analysis is a windsock, not a crystal ball." Therefore, one has to be willing to change with the prevailing winds and not seek to fight them.
When one is applying Technical Analysis to the market, it's always wise to find confirmations that support one's theories, not only technical, but fundamental.
SPX Gallery View
On the short term, there is an indication the SPX will rally this week (looking at the PPO on the daily chart indicator a reversal to the upside). However, the weekly remains decidedly bearish and the PnF chart still indicates a target of 925.
Now.. this is an interesting PnF chart. It reflects that the "Bullish Percent for the S&P 500" has reached a trend line that signals "Bear Confirmed":
DOW Bear confirmed on May 7th, 2010:
Bullish Percent DOW (INDU)
S&P 500 Bear confirmed on June 9th, 2010:
Bullish Percent SPX
Nasdaq Bear Confirmed:
Bullish Percent Nasdaq
Bullish Percent Index explained
And now.. we have Barron's telling us to "Call a Bear a Bear":
Call a bear a bear?
And this is a DEFINITE read for those making the Bearish case:
"Wall Street seems to have no concept at all that every bit of growth we've observed over the past year can be traced to government deficit spending, with zero private sector expansion when those deficits are factored out. As I noted last week, if one removes the impact of deficit spending, "the economy has recovered to the point where the year-over-year growth rate since early 2009 now matches the worst performance of any of the 50 years preceding the recent downturn." In effect, Wall Street's is seeing "legs" where the economy is in fact walking on nothing but crutches.
Similarly, it is apalling that Ben Bernanke can say with a straight face that many of the "investments" made by the Fed have been repaid "and some have even made a profit," without immediately noting that the two primary sources of these repayments have been, directly or indirectly, the U.S. Treasury, and savers who are receiving near-zero interest on bank deposit instruments.
If we fail to recognize that the "good news" reported over the past year is due not to a recovery in intrinsic economic activity, but instead to massive government intervention, we risk being blindsided as those synthetic effects gradually erode.
On that point, it is notable that the Economic Cycle Research Institute (ECRI) reported Friday that its Weekly Leading Index has slumped to the lowest level in 44 weeks, and has now gone to a negative reading."
Born on Third Base
More later....
Scrutinizer
Wednesday, June 09, 2010
Is there a Bullish case lurking out there that we're not recognizing?
Came across this article last night regarding the Arms Index reaching an extreme:
ARMS Index at 13.22.
ARMs Index explained

Arms said:
"The value for the day on Friday was extremely high. According to the Wall Street
Journal it was 13.22. They used the following components:Advances 315, Declines
2839, Advancing volume 13,602,600, Declining volume1,621,066,016.I have gone with
this since the numbers I got from other sources were obviously completely erroneous.
Sometimes, as in 1987 particularly, there is a lot of confusion.But watching the numbers
during the day on Friday, I think the WSJ must be close.
That makes this the fourth highest reading in at least the last seventy years, which is as
far as I can go back. On the chart above I have shown the daily readings going back to
1987, with the horizontal blue line at 10.00 for reference.You will observe that the
extremes such as we saw on Friday seem to come in at bottoms.They represent a sudden
rush for the exits, such that the declining stocks are receiving ten or so times as much
volume as the up stocks.In other words, the crowd mentality has taken over and stocks
are being indiscriminately dumped.It is a sign of fear and panic, and appears, in most
cases, to be misplaced fear, at least on the short to intermediate term."
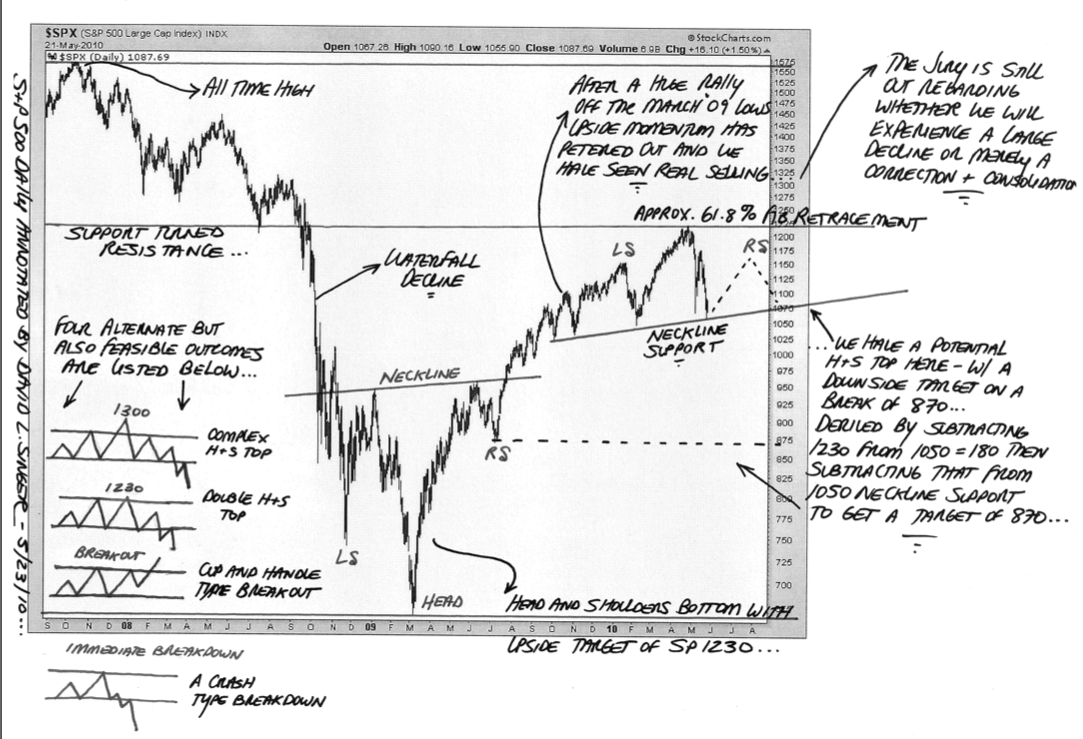
So.. Does that mean we're putting in a short term bottom with a rally towards this year's previous highs, thereby forming the "right shoulder" on H&S many have been seeing being formed, or could it lead to even higher highs, suggesting we're in a new Bull Market?
I don't know. As stated in previous posts, I remain overall bearish given M3 and that 10 years "Mother of all H&S" formations I've been seeing. But the reality is that if I can see it, then the Fed and Treasury can see the same thing and might be trying to orchestrate a global effort to break the technical "waterfall" that occurs when those right shoulders collapse below the neckline price.
DOW H&S formation.
We remain in an inflection point in the markets, with a currently bearish bias. But that doesn't mean the rallies can't come fast and sharp back up to critical resistance points. It will be interesting to see how much of that resistance can be overcome.
Which brings to "positive event risk" (for the bears). What lurks out there that could dramatically reverse this market to the upside?
The primary event that might make me turn bullish again, would be firm regulation and control over Credit Default Swaps, which are destroying the Capital markets.
Secondly, would be a concerted jobs program to spur re-hiring in the PRIVATE SECTOR (not public). We need to rebuild the demand curve in this economy and that can only come if we have more private workers than we have public ones. Because extended unemployment benefits are nothing more than a fancy term for Welfare, it would have made more sense subsidizing small business to retain, retrain, and hire workers, if only to avoid people losing job skills.
Certainly Europe stabilizing would be nice.. but I'm not counting on it.
That's about all I can perceive that would change my mind outside of the return of the Messiah.. ;0)
Scrutinizer
Came across this article last night regarding the Arms Index reaching an extreme:
ARMS Index at 13.22.
ARMs Index explained
Arms said:
"The value for the day on Friday was extremely high. According to the Wall Street
Journal it was 13.22. They used the following components:Advances 315, Declines
2839, Advancing volume 13,602,600, Declining volume1,621,066,016.I have gone with
this since the numbers I got from other sources were obviously completely erroneous.
Sometimes, as in 1987 particularly, there is a lot of confusion.But watching the numbers
during the day on Friday, I think the WSJ must be close.
That makes this the fourth highest reading in at least the last seventy years, which is as
far as I can go back. On the chart above I have shown the daily readings going back to
1987, with the horizontal blue line at 10.00 for reference.You will observe that the
extremes such as we saw on Friday seem to come in at bottoms.They represent a sudden
rush for the exits, such that the declining stocks are receiving ten or so times as much
volume as the up stocks.In other words, the crowd mentality has taken over and stocks
are being indiscriminately dumped.It is a sign of fear and panic, and appears, in most
cases, to be misplaced fear, at least on the short to intermediate term."
So.. Does that mean we're putting in a short term bottom with a rally towards this year's previous highs, thereby forming the "right shoulder" on H&S many have been seeing being formed, or could it lead to even higher highs, suggesting we're in a new Bull Market?
I don't know. As stated in previous posts, I remain overall bearish given M3 and that 10 years "Mother of all H&S" formations I've been seeing. But the reality is that if I can see it, then the Fed and Treasury can see the same thing and might be trying to orchestrate a global effort to break the technical "waterfall" that occurs when those right shoulders collapse below the neckline price.
DOW H&S formation.
We remain in an inflection point in the markets, with a currently bearish bias. But that doesn't mean the rallies can't come fast and sharp back up to critical resistance points. It will be interesting to see how much of that resistance can be overcome.
Which brings to "positive event risk" (for the bears). What lurks out there that could dramatically reverse this market to the upside?
The primary event that might make me turn bullish again, would be firm regulation and control over Credit Default Swaps, which are destroying the Capital markets.
Secondly, would be a concerted jobs program to spur re-hiring in the PRIVATE SECTOR (not public). We need to rebuild the demand curve in this economy and that can only come if we have more private workers than we have public ones. Because extended unemployment benefits are nothing more than a fancy term for Welfare, it would have made more sense subsidizing small business to retain, retrain, and hire workers, if only to avoid people losing job skills.
Certainly Europe stabilizing would be nice.. but I'm not counting on it.
That's about all I can perceive that would change my mind outside of the return of the Messiah.. ;0)
Scrutinizer
Tuesday, June 08, 2010
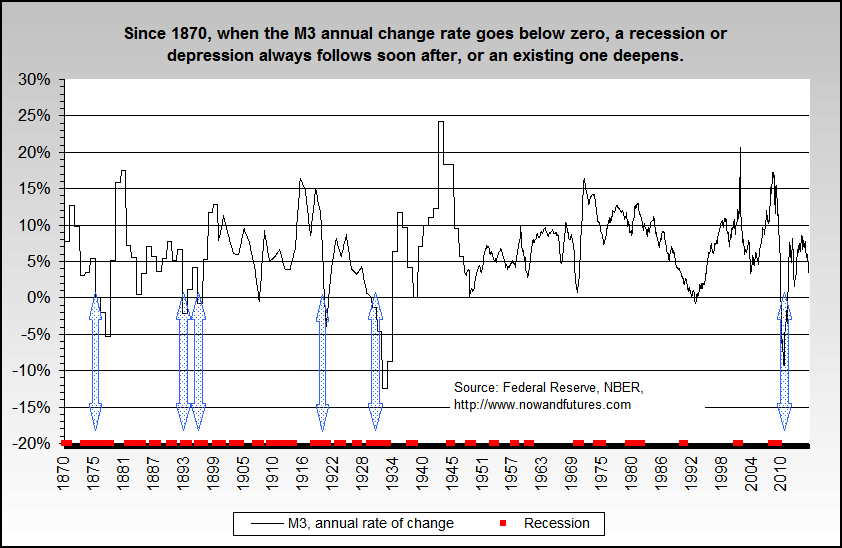
M3 has gone negative in a BIG way.
M3 is a measure of money supply. The Fed claims they no longer track M3, but many other fundamental analysts and economists still do. Here's a Wiki link to help explain it:
Wiki page on M3 and Money Supply
M3 has gone negative this past year. The last time it did that was during the Great Depression Kind of frightening, isn't it?
M3 historical chart
The Fed can foolishly attempt to persuade us that M3 doesn't matter.. But to those who track it, it apparently does.
Russell 2000 (RUT) breaks 50 Week MA.
Mr. Bernanke says we're not going into a "double-dip" recession. I would beg to differ if the charts can be believed.
First off, let me review Parabolic SARs. Simply put, SAR means "Stop and Reverse". When the price of the equity/index penetrates one of these SARs, they "flip" either upward or downward. Flipping an SAR upward means the "dotted line" falls to the last major support level and then starts trending upward. When an equity is declining and penetrates an SAR, the "dotted line" flips up to the last high, which now becomes resistance.
Generally speaking, flipping an SAR upward generates short covering and buying. Consequently, when an SAR flips downward, it generates selling. The longer the time period used in the chart, the stronger the signal.
RUSSELL 2000 Breakdown
The Russell 2000 suffered a major breakdown today. It's last major point of support was the 50 Week Moving Average (MA) and it failed to hold:
RUT Weekly Chart

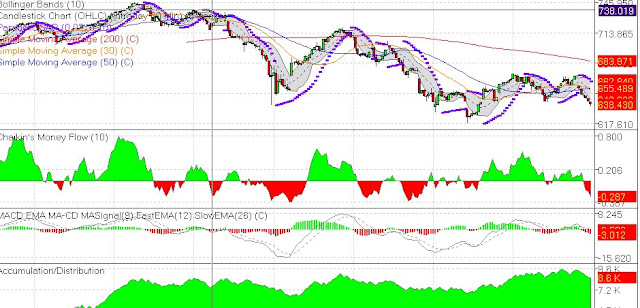
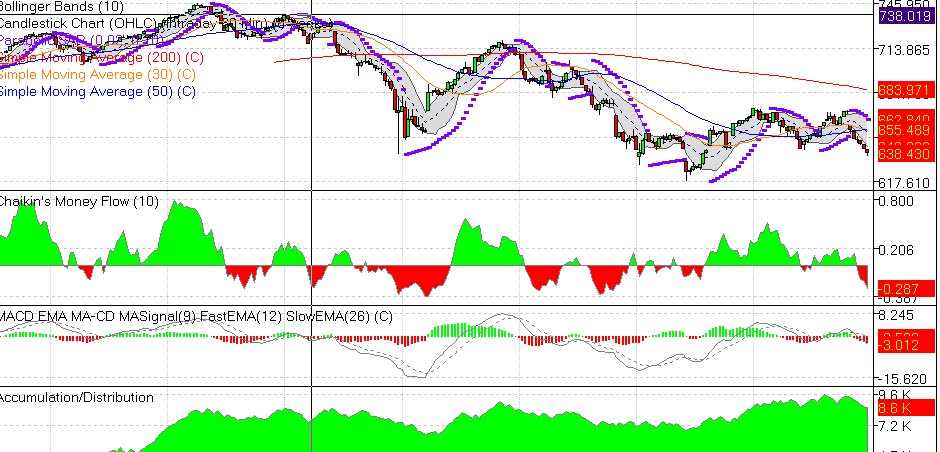
Additionally, the inverse 3x Bear ETF on the Russell (TZA) also "flipped" it's Daily SAR to an upward bias.
TZA Daily Chart

As some might recall, the TZA "flipped" it's weekly SAR a few weeks back when the RUT crossed under it's 200 WEEK MA, which indicated the index was in distribution. Flipping the TZA Daily SAR was the last bit of resistance (support?) to halting a sell off in the RUT to it's next level of support, found in the Monthly RUT chart:
RUT Monthly chart

The RUT is in serious trouble. The Monthly chart above suggests that the next level of support for the RUT is 581 which is the lower arm of the Monthly Bollinger Band. However, I believe the ultimate target is a test of the Monthly SAR, which is currently located at 487.
If that occurs, then TZA, being a 3x Ultra-Bear ETF on the RUT, could stand to appreciate considerably during this retreat in the RUT to that Monthly support line.
It's been my theory that the Small Cap indices, such as the RUT, would become a source of funds for supporting the S&P 500 and DOW 30. I think we're starting to see this come to fruition.
We can see by the "flipping" of the TZA Daily SAR, that the next point of resistance is TZA's 200 day MA (which, btw, is substantially different than the RUT's 200 Day MA, which was penetrated to the downside a few days ago. To properly reflect it's position as an inverse ETF to the Russell, both should cross their 200 Day MAs at the same time. But this hasn't happened for some time. Possibly RUT longs have been shorting TZA as an arbitrage, thereby skewing the equilibrium between the index and it's inverse ETF.
This suggests that TZA has substantial upside as it attempts to equalize to it's inverse index.
Scrutinizer
M3 is a measure of money supply. The Fed claims they no longer track M3, but many other fundamental analysts and economists still do. Here's a Wiki link to help explain it:
Wiki page on M3 and Money Supply
M3 has gone negative this past year. The last time it did that was during the Great Depression Kind of frightening, isn't it?
M3 historical chart
The Fed can foolishly attempt to persuade us that M3 doesn't matter.. But to those who track it, it apparently does.
Russell 2000 (RUT) breaks 50 Week MA.
Mr. Bernanke says we're not going into a "double-dip" recession. I would beg to differ if the charts can be believed.
First off, let me review Parabolic SARs. Simply put, SAR means "Stop and Reverse". When the price of the equity/index penetrates one of these SARs, they "flip" either upward or downward. Flipping an SAR upward means the "dotted line" falls to the last major support level and then starts trending upward. When an equity is declining and penetrates an SAR, the "dotted line" flips up to the last high, which now becomes resistance.
Generally speaking, flipping an SAR upward generates short covering and buying. Consequently, when an SAR flips downward, it generates selling. The longer the time period used in the chart, the stronger the signal.
RUSSELL 2000 Breakdown
The Russell 2000 suffered a major breakdown today. It's last major point of support was the 50 Week Moving Average (MA) and it failed to hold:
RUT Weekly Chart

Additionally, the inverse 3x Bear ETF on the Russell (TZA) also "flipped" it's Daily SAR to an upward bias.
TZA Daily Chart

As some might recall, the TZA "flipped" it's weekly SAR a few weeks back when the RUT crossed under it's 200 WEEK MA, which indicated the index was in distribution. Flipping the TZA Daily SAR was the last bit of resistance (support?) to halting a sell off in the RUT to it's next level of support, found in the Monthly RUT chart:
RUT Monthly chart

The RUT is in serious trouble. The Monthly chart above suggests that the next level of support for the RUT is 581 which is the lower arm of the Monthly Bollinger Band. However, I believe the ultimate target is a test of the Monthly SAR, which is currently located at 487.
If that occurs, then TZA, being a 3x Ultra-Bear ETF on the RUT, could stand to appreciate considerably during this retreat in the RUT to that Monthly support line.
It's been my theory that the Small Cap indices, such as the RUT, would become a source of funds for supporting the S&P 500 and DOW 30. I think we're starting to see this come to fruition.
We can see by the "flipping" of the TZA Daily SAR, that the next point of resistance is TZA's 200 day MA (which, btw, is substantially different than the RUT's 200 Day MA, which was penetrated to the downside a few days ago. To properly reflect it's position as an inverse ETF to the Russell, both should cross their 200 Day MAs at the same time. But this hasn't happened for some time. Possibly RUT longs have been shorting TZA as an arbitrage, thereby skewing the equilibrium between the index and it's inverse ETF.
This suggests that TZA has substantial upside as it attempts to equalize to it's inverse index.
Scrutinizer
Sunday, June 06, 2010
BP Billion Dollar engineering at work:
Can ANYONE tell me what's wrong with this picture? :
Live feed from BP valve 5,000 feet down on that well head
Anyone notice the Duck Tape?
Scrutinizer
Can ANYONE tell me what's wrong with this picture? :
Live feed from BP valve 5,000 feet down on that well head
Anyone notice the Duck Tape?
Scrutinizer
Friday, June 04, 2010
SPX and RUT to retest previous lows: Will they hold, or is there more downside to come?
Turmoil in the Euro, which closed below 1.20 to the USD for the first time in 4 years. Hungary suggesting that debt default is not out beyond exaggeration. Continuing tensions on the Korean Peninsula. AND, OF COURSE, the lousy jobs report where only 20,000 private sector jobs were created in May.. The list goes on for reasons to sell this market.
I ran the Hourly chart on both the S&P 500 (SPX) and the Russell 2000 (RUT) and discovered that the 30 Hour Moving Average (MA) has crossed under the 50 Hour MA. The previous two instances where this occurred resulted in nearly 100 point losses on both indices before they bottomed.
SPX Hourly chart:

RUT Hourly Chart:
Follow the yellow line (30 Hour MA) as it crosses below the 50 Hour MA (blue line).
Very frightening, eh?
But it's possible that we may see a relief rally that takes us back up to that 30 Hour MA. That would likely be the time to sell or short, and look for a bottom. For the RUT, that short-term bottom may occur at RUT 570.
Scrutinizer
Thursday, June 03, 2010
Bilderbergers throwing a Euro "Bash"??
It seems the Illuminati (err.. Bilderbergers.. ;0) are throwing their annual bash near Barcelona this year (love that city!)
http://www.timesonline.co.uk/tol/news/world/europe/article7142478.ece
Can they save the Euro? Or are they actually behind it's demise?
I wonder how many of them are holding Credit Default Swaps on European debt, hoping the whole lot defaults and transfers considerable wealth into their coffers.
I always find it a bit humorous to read all the conspiracy theories about the Bilderbergers, Trilateral Commission, and CFR. I'm sure that these guys probably like to think they have some control over the "New World Order", but I'm sure trying to control human beings is tantamount to herding cats.
And I've no doubt that various groups are always plotting and scheming to impose their will (or profit from turmoil). But they've got a lot of competition from the Arabs, the Chinese, and of course, the Hedge Funds.
For every conspiracy there's a counter-conspiracy, IMO.
Scrutinizer
SPX Monthly SAR "Flips".. Bearish signal?
The SPX Parabolic SAR has flipped downward. Previous instances where this has occurred has provided a strong signal of an significant decline in prices. The last time this occurred was in 2008.
Currently the Monthly PSAR is located at 1220, which coincides with the 50 Month Moving Average. That may provide a powerful obstruction to higher prices and signal distribution.
HOWEVER, this doesn't mean that the index won't make an attempt to bust through 1220. Should it do so, the PSAR will flip upward, at around the 200 Month MA.
One thing is clear, the SPX needs to maintain the 200 Month MA, or it's going to get VERY interesting.

And here's a bonus chart.. AAPL is knocking it's head on its Weekly PSAR. It truly needs to "flip" this if it's going to achieve new highs. Currently that "flip" point appears to be $267/share.

Also note that once they do manage to flip these SARs, we'll often see a period of consolidation to the middle of the Bollinger Band channel (the black dotted line).
Recall from a previous post that I'm watching AAPL very closely because it's the now the largest Nasdaq stock out there, having surpassed MSFT in market cap. MSFT was the darling of the markets in 2000 and when it's stock declined, it signaled the end of the Internet Bubble, which also formed the left shoulder of this 10 year Head and Shoulders formation we've been putting in place. So now I opine that AAPL represents the one stock that will indicate when the right shoulder of that Head and Shoulders has been put in place. No new high and we could quickly see a sell-off to far lower prices.
Wednesday, June 02, 2010
Phytoplankton Declines and Rising CO2 levels: the missing link?
For a long time I've been a skeptic with regard to the effects of CO2 on our climate. CO2 levels have been higher and lower throughout Earth's history, long before mankind ever emerged as a parasite on the back of "mother earth":
500 million CO2 record
CO2 record for the past 400,000 years
Throughout those millions of years, nature has dealt with those excessive CO2 emissions that have emanated from various natural sources. Botanical life adapted to consume it until a form of equilibrium was established according to available resources. This floral bio-remediation took the form of both terrestrial plants, as well as oceanic plant life in the form of single celled phytoplankton that form the foundation of the marine food chain along with sequestering over 50% of all atmospheric CO2.
We been bombarded with warnings from folks like Al Gore, Tom Friedman, and so many others, all trying to convince us that our hydrocarbon emissions have increased CO2 levels to the point where we're on a unstoppable cycle of global warming (or is it climate change now?). It's claimed that CO2 levels are up to 30% above the known cyclical highs from previous warming periods and that ONLY man-made CO2 emissions can be responsible for that increase.
But could there be another reason that atmospheric CO2 levels have increased? Could it have something to do with the fact that phytoplankon levels have declined 20-30% over the past 30 years??
Isn't just a bit coincidental that CO2 levels have risen at a level that corresponds to observed phytoplankton declines?
If the ability of the oceans to absorb CO2 diminishes by 20%, does it not make sense that atmospheric CO2 levels would rise by the same level?
This, of course, assumes that all the necessary nutrients exist to permit phytoplankton to flourish. Anyone with a green thumb knows that it requires the proper balance of nutrients, temperature, and solar exposure, to make a garden grow. If any of these elements are lacking, plant growth is inhibited.
Many scientists have noted this decline, but have attempted to blame it on increased ocean temperatures, although I'm not sure the science upholds their theories.
Phytoplankton declines of up to 30% in several oceans
Decline in phytoplankton due to warming oceans?
Historical Decline in Phytoplankton coincided with Global COOLING.
Now.. one of the elements that's critical to ALL plant life is Iron. Without it, plants can't produce chlorophyll. Without chlorophyll, plants cannot absorb CO2, or conduct photosynthesis, by which they produce both their food and oxygen. Iron deficiency results in a condition known as Chlorosis:
Chlorosis
In numerous areas of the planet's oceans are "dead spots". Despite being rich in nutrients, they do no sustain significant quantities of phytoplankton. Dr. John Martin proposed during the 1990's that the addition of a small quantity of iron in High Nutrient, Low Chlorophyll (HNLC) areas of the ocean would produce large blooms of phytoplankton and sequester tons of CO2. In fact, the very fact that these areas ARE HNLC, but not producing phytoplankton, seems the most damning evidence against blaming warming oceans being the cause of phytoplankton declines.
John Martin and the Iron Hypothesis
Pros and Cons of Iron Fertilization
Given sufficient nutrients, there should be no limit to how much CO2 can be sequestered by botanical life forms. Plants will grow until they lack a vital element they require to sustain that growth. But since Iron is a rare element in our oceans, blown there as eroded dust from terrestrial winds, it's the one factor that limits the growth of phytoplankton.
And I'll admit that it's possible that anthropogenic emissions of CO2 from the burning of hydrocarbons has depleted oceanic deposits of Iron. But that only suggests that we have a responsibility to replenish that iron, if only because phytoplankton are also the foundation of the marine food chain. Every marine life form depend upon phytoplankton, directly or indirectly.
John Martin died many years ago, but his theories still live on. Various scientific expeditions have been launched to prove his theories, but have generated tremendous opposition from other scientists who reject the idea of "geo-engineering".
Yet.. we need Carbon Credits to "resolve" the alleged problem of "Climate Change"? We need to tax people, granting permission for them to emit a natural substance, CO2, which nature using as a vital element in the growth of botanical life on this planet?
This is crazy.. And it's dangerous because it leads us into Malthusian style thinking and population control. It's ultimately about the elite, who can afford to buy into the carbon credit scheme, controlling the masses, who cannot.
I'm just as much a conservationist as your average person.. But I'm not so stupid as to actually believe that CO2 is a "pollutant" as the EPA would like to have us believe. Too much of ANYTHING is bad. Too much oxygen would be just as bad for the existing ecosystem as too much CO2. But nature has experienced numerous periods where there was too much CO2 and plant life restored the equilibrium over time, as nutrients became available.
Scrutinizer
Conspiracy Corner: Goldman Sachs, Carbon Credits, and the BP oil spill.
Ok.. I'm not generally one who is given to conspiracy theories, but I've found one that's has, even me, saying "WTF!!".
We all know how this BP oil spill on the southern coast has proven to be extremely difficult to contain. Failure after failure has been the result and now this final attempt to cut the well-head pipe has resulted in the saw getting stuck.
The environmental fallout is seen as a catastrophe that rivals Katrina in it's potential for devastating the fishing industry and sullying any number of gulf coast beaches. In an attempt to contain the spreading oil slick, they have sprayed dispersing chemicals (very toxic in their own right), and attempted to use booms and skimmers to contain and collect the slick.
But there is a conspiracy theory that is starting to go viral regarding the entire event. I'm not going to suggest that I subscribe to this theory, but it raises questions that deserve to be answered.
Let me start here.. A report that Goldman Sachs sold over 4 million shares of British Petroleum in the 1st quarter of this year:
According to regulatory filings, RawStory.com has found that Goldman Sachs sold 4,680,822 shares of BP in the first quarter of 2010. Goldman's sales were the largest of any firm during that time. Goldman would have pocketed slightly more than $266 million if their holdings were sold at the average price of BP's stock during the quarter.
If Goldman had sold these shares today, their investment would have lost 36 percent its value, or $96 million. The share sales represented 44 percent of Goldman's holdings -- meaning that Goldman's remaining holdings have still lost tens of millions in value.
Goldman Sachs big oil "spill"
How convenient!! How fortuitous for the company that had 100 STRAIGHT DAYS of trading profits (which means, for 100 days, anyone that traded against them lost). How fortuitous for a company that's banking serious cash using High Frequency Trading (recall that, reportedly, these HFT systems were turned off during the "Flash Crash" that led to a 1000 point drop in the DOW.
GS, the "Vampire Squid"?
According to a SEC filing released earlier today, Goldman Sach Group Inc.'s traders made a total of $9.74 BILLION in net revenues in Q1/2010. This number works out to a total of 76% of the company's first quarter revenues.
An even more incredible number - of the 63 trading days in Q1/2010, the traders at Goldman Sachs did not have even ONE losing day.
That's right - Goldman Sachs hit .1000 in the first quarter. This stunning result doesn't exactly help the firm remove the perception that the markets are rigged by and for Goldman Sachs.
Of the 63 trading days in Q1, Goldman Sachs reported profits of over $100 million in 35 of them. So, the traders at Goldman Sachs managed to rake in over $100 million for the firm in over half of the days in Q1/2010.
The Gold Sach Profit Machine.
Not a single losing day for GS in 1st Quarter 2010.
Ok.. so now we see the foundation of the the financial conspiracy. GS sells BP.. BP has a terrible accident that STILL DEFIES EXPLANATION, and now we find out it may be August before the spill is contained. It's a disaster!! A catastrophe!! It's ruining Obama's opinion poll numbers!!
Heck, even Thomas Friedman, is becoming hysterical, sitting in his energy gulping, Bethesda, MD mansion, declaring that the BP oil spill is Obama's "9/11":
No, the gulf oil spill is not Obama’s Katrina. It’s his 9/11 — and it is disappointing to see him making the same mistake George W. Bush made with his 9/11. Sept. 11, 2001, was one of those rare seismic events that create the possibility to energize the country to do something really important and lasting that is too hard to do in normal times."
BP disaster is Obama's 9/11.
Now what kind of "Lemonade" could Obama possibly make from this box of sour citrus?
How about shutting down all offshore drilling in the Gulf, a major political issue for the more environmentally minded liberals?
How about getting that darn "Cap & Trade" legislation passed? This BP event has the potential for re-instilling some serious "mojo" into the Carbon Tax concept re-energizing the idea that we need a Carbon tax to force us to use alternatives to hydrocarbons
Goldman Sachs is a founding member of the "Green Exchange"
Big Money to be made in trading Carbon Credits!! And with their demonstrated expertise in going for an entire quarter without a loss suggests they want to rig the Carbon markets too!!
Now.. did you listen to Obama's speech this afternoon? It was vehemently political, blaming Republicans for obstructing all manner of policy initiatives put forth by Obama's administration, including Carbon Credits:
And the time has come to aggressively accelerate that transition. The time has come, once and for all, for this nation to fully embrace a clean energy future. (Applause.) Now, that means continuing our unprecedented effort to make everything from our homes and businesses to our cars and trucks more energy-efficient. It means tapping into our natural gas reserves, and moving ahead with our plan to expand our nation’s fleet of nuclear power plants. It means rolling back billions of dollars of tax breaks to oil companies so we can prioritize investments in clean energy research and development.
But the only way the transition to clean energy will ultimately succeed is if the private sector is fully invested in this future -- if capital comes off the sidelines and the ingenuity of our entrepreneurs is unleashed. And the only way to do that is by finally putting a price on carbon pollution.
Obama June 2, 2010 speech at Carnegie Mellon
And who's to set that price for "Carbon Pollution".. Why Goldman Sachs, of course!!
So there's the financial foundation for the BP conspiracy.
But wait.. There's another tangent to this BP oil conspiracy. Some have asked the question as to why it's taken so long to FINALLY figure out a NATURAL MEANS of dispersing and eliminating these millions of barrels of Hydrocarbons spewing from ocean floor? They've spread dispersing agents, which are just as toxic as the oil itself, but ONLY NOW are we seeing commentary about using PROVEN natural microbes that feast on hydrocarbons. In fact, these microbes evolved in response to NATURE'S own little oil spills, which have occurred over the eons.
Watch this video.. as tens of thousands of other people have, and ask yourself why this technology wasn't deployed immediately?
Oil Eating Microbes could mitigate much of the damage to the Gulf oil spill
Yes indeed... Why weren't oil consuming microbes immediately deployed to consume the oil spewing from that well? Especially since these microbes would then recycle that oil back into the marine food chain, serving the purpose for which nature evolved them?
Nature has dealt with oil leakages for Billions of years and we think we can do a better job?
Scrutinizer
Two items for this morning.. "“Individual investors placed a greater emphasis on return of capital last month because of the volatility in the stock markets. The movement of portfolio dollars out of equities and into bonds/bond funds and cash corresponds with the latest AAII Sentiment Survey, which showed bearish sentiment at 50.9%, the highest level of pessimism recorded since November 5, 2009. (Bearish sentiment is the expectation that stock prices will fall over the next six months.)”"
Are small investors popping smoke and leaving the stock market?
It's worth going back and reviewing this article on what likely caused the flash crash of early May:
"According to this Wikipedia article on quantitative trading strategies, HFT recently accounted for more than 70% of all trading volume on US stock exchanges. Does it matter when these firms stop trading and pull all their bids? You bet it does."
Dress Rehearsal for fully automated crash.. Flash Crash revisited
Pretty frightening prospect to know when you're buying a stock you're trading against computers who can pull the rug out from under the market for your company's shares in a split second.
It's apparent the markets are not so much about human decisions regarding "price discovery" in assessing the fair market value of a particular asset. Computers are making these decisions and they are non-emotional, calculating devices. So essentially people are just feeding money into these digital trading systems, systems that can quickly manipulate prices for a stock with the flip of a switch.
Little wonder that investors saw the "flash crash" as a sign that the market is rigged against them and have decided to seek safer havens. And certainly that decision has been influenced by the tremendous event risk I spoke of in my previous post.
Scrutinizer
Tuesday, June 01, 2010
When will the pain end (at least for now)??
There's a sentiment indicator that some technicians utilize to help assist in determining bullish/bearish sentiment.
This is for the Dow Industrials.
$BPINDU bullish sentiment
Note that the trend line indicates that the likely potential bottom will be when bullish sentiment reaches 36%. It may go lower, it may reverse higher than that trend line.. It's just a reference and we can see that it's bottomed at previous points on the trend line.
Note... you can also pull up a Point and Figure (PnF) chart (the Grand-Daddy of all Technical Analysis) for the DOW and SPX ($indu, $spx.. and throw in the Russell 2000 for good measure, $rut)
They will show you that the SPX has a downside target of 925 on this Pnf chart:
S&P 500 PnF
And for my friend Megan, here's that Video I promised you where the Karl Deninger makes a analogy between current market conditions and 2007:
Whistling past the (Investors) Graveyard
Scrutinizer
Commodities are collapsing.. Bear signal we haven't seen since fall of Lehman..
Bear Signal... Commodities show biggest drop since Lehman collapse.
Watch the RUT (Russell 2000). It's being cannibalized to prop up the larger indices so they can distribute.
As Richard Russell stated, we have a "Hard Rain" coming.
Hard Rain a'coming!!
Scrutinizer
Bear Signal... Commodities show biggest drop since Lehman collapse.
Watch the RUT (Russell 2000). It's being cannibalized to prop up the larger indices so they can distribute.
As Richard Russell stated, we have a "Hard Rain" coming.
Hard Rain a'coming!!
Scrutinizer
How to define "Event Risk".
Ok.. I'm motivated to write another post today because my head is reeling over what transpired overnight with Israel's boarding of that Turkish vessel filled with "humanitarian aid" for Palestinians living in Gaza.
First off.. I'm going to try and maintain my objectivity with regard to Israel's actions. I'm not Jewish, nor am I a die-hard Zionist. The only reason I support Israel is because it's the only truly democratic state (flawed as it may be) in the region. Hamas, although it was elected, can hardly be considered "democratic", nor do they permit any effective opposition. Furthermore, they have publicly stated that it's not just the elimination of Israel that they seek, but also the restoration of the Islamic Caliphate, as well as conquest of Europe and the "Two Americas"..
Don't believe me? Watch for yourself (courtesy of MEMRI):
From the Horse's mouth.. Dirka, Dirka, Jihad
It's clear that Hamas is in a perpetual state of war with Israel until they have succeeded in destroying the Jewish state. They will not make peace because it would be against their political charter and undermine their very "raison d'etre".
But politics aside, the issue at hand is how Israel should respond to attempts by so-called "humanitarian" groups attempting to assist Hamas and remove the blockade/seige.
I think Israel didn't think this through very well. Obviously fast-roping commandos onto the decks of this ship didn't turn out the way they thought it would. Now they have created an ENORMOUS problem for themselves because the 9 deaths that resulted have made their former ally, Turkey, extremely angry, possibly to the point of open hostilities.
Israel should have relied upon non-lethal means to disable the ship. The use of heavy netting, laid in front of, or bracketed by several Israeli patrol boats, would likely have fouled the ship's propellers and forced it to be towed.
And now that these groups are threatening to send another ship to break the blockade (the RV Rachel Corrie, registered in Ireland), they DEFINITELY need to get a grip on a non-lethal deterrence or interdiction technique that separates protesters from IDF personnel. The Israelis have already stated they will stop and detain this, and any other ship, that attempts to break the blockade.
However, in the process Israel has now essentially alienated any allies that it possessed, so we should not understate the level of tension right now. Egypt, which had been also blockading Gaza, has suddenly opened up those gates. It's even possible that Egyptian forces may be mobilized to establish a presence in Gaza. If this occurs, hopefully it will lead to the overthrow of Hamas (which Egypt truly despises as it is an offshoot of their own Muslim Brotherhood).
But how are the markets going to take this is the question? Who in their right mind is going to believe that a potential war between Turkey and Israel would be a reason to buy stocks, either in Europe, or the US?
North Korea
North Korea is a situation that is also factoring into global "event risk". NK is a nuclear power and therefore, presents a scenario where they could choose to create significant turmoil in the region with only the risk of economic sanctions (which already exist). There is no way the UNSC is going to vote for any military response in answer to the sinking of the S. Korean ship.
One should also remember that NK has several hundred artillery batteries within range of Seoul, S. Korea. Any outbreak of hostilities would lay the SK capital to ruins and result in a horrendous refugee problem, as well as economic tumult for the 15th largest economy in the world. It would become a war of attrition fought across the 38th parallel and via naval engagements and bombing raids.. All because no one in their right mind would be willing to risk a nuclear attack that would be the obvious response to any threat to the NK regime.
Kim Jong Il is getting old and he wants his son to assume power upon his death. But the military, it is rumoured, doesn't think Kim is being aggressive enough and it's possible they are following their own course of action with regard to war with SK. Generals derive their power from their "toys" and if they don't get to eventually use them, they can assert the current regime is not assertive enough in advancing NK's interests.
So, regardless of whether Kim actually ordered that attack on the SK ship or not, he owns the situation now and has to save face and stand firm and defiant. He will not bow to Chinese pressure, IMO. And China has no desire to see hundreds of thousands of NK refugees flooding across their border with NK.
It's also possible that Bejing has an interest in permitting a bit of turmoil to erupt in order to advance their own global political position. I don't see them exerting too much pressure on Pyongyang without obtaining some valuable concessions in return.
Thus, why would anyone want to buy stocks when such a scenario lies before them?
Europe
Then there's the problems with the EU.. I'll be short with this since it's been covered all over the internet. The Euro came within a hair's breath of breaking long-term support this morning and sparking a decline that some postulate would result in parity between the USD and Euro. (1:1). It's possible that this may happen tomorrow..
Understand this. Europe NEEDS AND MUST HAVE a lower Euro if they are to grow their way out of this debt mess in which they find themselves. They need to EXPORT BABY, EXPORT!! to generate revenues. So they are pursuing a "beggar thy neighbor" policy that has been followed by both Japan and China for years now. And all of this will be at the cost of US exports and markets. We'll buy more and sell less, thereby reigniting the long-standing problem of our trade deficits.
So don't expect Europe to get it's act together anytime soon. They want a cheaper Euro, but they have to be careful how they go about achieving it without appearing to be waging the mercantilist economic war they require.
Also remember that China owns over $600 Billion Euros worth of reserves. If the Euro falls to parity with the USD, China takes nearly a 20% haircut on that cash stockpile. That's not going to sit well with them.
Flash Crash.. Is this fixed, or just a preview? Or can the computers get switched off again and send the DOW down another 1,000 points in the blink of an eye??
I'll be honest.. I'm playing TZA, which is a Ultra-short ETF that's inverse to the Russell 2000. I figure that even if the Dow and S&P manage to stabilize in the short-term, it's going to come at the expense of the small caps. They are going to become a source of funds for propping up the large cap indices as a last gasp effort to stave off what appears to be the inevitable collapse from that 10 year H&S formation we're forming.
So that's what our markets are facing right now.. Why do you want to buy when your potential loss is upwards of 40-70% before all is said and done?
And lastly, I'll leave this to ponder.. What if you were any number of leaders of a tyrannical rogue state. And what if you had considerable assets (all of which you've exploited from your oppressed masses) squirreled away in foreign bank accounts? And what if you happened to be savvy enough to see that 10 year H&S formation and wondered, "What can I do to initiate, and therefore profit from, that collapse? Kim Jong Il has billions of dollars worth of assets in foreign accounts, all managed by his son.
Seems to me that's one hell of a motivation to create as much tension as possible short of outright war and risk to the regime.
That's all for now.. more later...
Scrutinizer
Been about a year since I've blogged.. Things have been hectic and full of family crisis..
I've decided that I need to post this chart for everyone to ponder. It involved a chart formation that Technical Analysts refer to as a "Head & Shoulders" formation. It's EXTREMELY BEARISH if it resolves to the downside.
Here's the chart:
Mother of All Head & Shoulders
One must recall that while this chart covers from the 1960 to present, the most important portion to review is the past 11 years from the popping of the internet stocks, through 2008 and the popping of the real estate bubble, to present day, where "event risk" is in all the headlines. This event risk can range from the breakup of the EU to potential conflict on the Korean peninsula or mid-east.
In understanding H&S formations, there is a left shoulder (formed in 2000), the head (formed in 2007), and now the right shoulder (formed over the past 2 years).
David Singer pointed out this H&S formation and potential implications in the following chart. Pay particular attention to the potential scenarios he draws out at the bottom left of this chart. Note that he is describing a "minor" H&S potentially forming within the time range of 2008 to present, while the chart I show above is over 11 years:
Anyone got a parachute?
And another market analyst who sees the same thing and posts his opinion on the DOW, as well as many other critical charts important to future economic growth:
Even more frightening charts
Now for those who have paid attention, they will recall that in 2000 Microsoft (MSFT) was the largest cap stock in the Nasdaq and that marked the top of the "left shoulder". Right now Apple (AAPL) has surpassed MSFT's market cap for the first time and it's my belief that it will determine when (or if) that right shoulder manifests itself. I see that there was a upgrade for AAPL today that puts a target on the stock well over $300 (currently $264 as I type this). A new high in AAPL, or breaching of the Weekly Parabolic SAR at $267-268, could provide a respite to the downturn. It's a critical price level I'm watching.
Additionally, we had the "Flash Crash" where the DOW dropped 1000 points in under 15 minutes. We still have no explanation for that event. I suspect that it reflects the fact that more and more investing is computerized and when the computers shut down (especially those conducting "High Frequency Trading") it pugs the rug out from under the market. I don't see anything that prevents another repeat of such an event.
Does that make you want to go long in this market?
The implications are clear.. We're at an inflection point in the American stock markets that we haven't seen since the 1930's. If this market resolves into a H&S formation, the consequences (and price declines) will be incredibly severe. Support on this chart is not likely until DOW 3,000.
Now.. many readers might question and say.. "Hey Scrut.... Most US companies have posted better than expected earnings this past quarter.. so how can the markets go down??!!!"
Listen.. we had a Trillion $$ DIRECT STIMULUS package, almost 10% of US GDP, that has only yielded 3% economic growth. That's a 3:1 ratio of taxpayer funded debt to generate 3% economic growth.
JPM has a balance of almost $1 Trillions, yet could only obtain 3 Billion in profit:
"JP Morgan has a balance sheet of $1 trillion and can borrow at essentially zero, he notes. So if they just go out and buy 10-year bonds at 3% they should be able to earn $30 billion a year. Yet the bank announced a profit of $3.3 billion last quarter."
How to make $3 Billion on a Trillion dollar portfolio (scroll halfway down)
Furthermore, commodities are no safe haven (beware gold bugs):
Commodities Con
Richard Russell, noted student/teacher of the Dow Theory has issued a dire warning of impending collapse (and he has considerable credibility).
Hard Rain a'coming!!
What we're seeing is deflationary pressures and de-leveraging. A world gone crazy and extremely vulnerable to event risk. M3 money supply contracted at rates not seen since the 1930's.
M3 money supply contracts at 1930's pace
That's people paying off, and/or defaulting on debt. Debt that is erased equates to destruction of money supply. Destruction of money supply that exceeds creation of new money (via new interest bearing debt) is deflationary.
Most importantly, the speculation in unregulated "naked" Credit Default Swaps is creating a domino effect where asset prices are being undermined by "non-insurable interests". That's a fancy way of saying that your neighbor can speculate that your house will burn down, buy an insurance policy against such an event, and the proceed to perpetrate arson against your home in hopes they can collect on that insurance.
Why would any company, or nation for that matter, want to issue new debt under such conditions? Without regulation of the CDS markets, there is no incentive take on risk to create economic growth. That's incredibly deflationary.
Therefore I'm recommending either people move to cash, bonds, or "Bearish" ETFs (though not without their own inherent risk given that several ultra-bear ETFs were just as affected by the "Flash Crash" as the long ETFs).
Bearish ETF list
I'll try and post more often now.. We're at a very critical inflection point in our markets, IMO.. And I'm advising all my friends to get defensive until we see clear signs of a buy signal. One of the means I use to assess that is using Parabolic SARs as a TA indicator. I'll try to speak more on that in a future post.
Scrutinizer
Wednesday, April 08, 2009
Evidence of abuse by short-sellers (Naked Short Selling):
Margin debt is down 55% since 2007:
http://suddendebt.blogspot.com/2009/04/margin-debt-again.html"
YET.. March, 2009 saw the largest increase in short interest in over 9 months!!!
http://zerohedge.blogspot.com/2009/03/early-march-saw-largest-increase-in.html"
Some short sellers claim that short selling enhances "price discovery". But since the only stock that is supposed to be available for shorting is MARGINED STOCK, please tell us again just how is short selling creating “price discovery” in the past 2 years?
This smells like fraud to me, if not outright counterfeiting of stock certificates.
Again, short selling is a legitimate means for countering excessive use of margin. When margin debt decreases, short selling should ALSO decrease to meet the available supply of shortable (margined) stock.
So we're left with only 2 conclusions. Either mmkrs/specialists are loaning out stock held in cash positions, or they are counterfeiting shares and selling them into the market.
Scrutinizer
Friday, December 14, 2007
Haven't been too active on this board recently.. but I see I'm starting to get some comments, so it's time to update some of my positions...
As I mentioned in a reply to a comment from imapedestrian, I've tearfully sold out of my CCUR position, and reallocated it to GNBT based upon Technicals and the perception that they are about to go Phase III on their Ora-lyn insulin delivery system..
I do remain skeptical about GNBT's CEO, Anna Gluskin, but I think that some of their directors will provide the necessary managerial credibility. Dr. Gerald Bernstein, a former president of the American Diabetes Association, is on their BOD, and would be an excellent "face-man" for the company when it comes time to do CNBC interviews. But even if he's operating behind the scenes, that's fine with me..
Anyway.. the chart for GNBT indicates we're very close to an inflection point on a rising wedge formation, which could lead to a breakout that takes the stock almost 75% higher to the $2.50/range within the next 30-60 days.
Daily chart:
Daily chart
Note the "golden cross" of the Moving Averages on the daily chart... Very bullish, IMO, although we may have a short-term pull-back consolidation.. Volume has been very good in recent weeks and it appears accumulation is occurring.
And when we look at the monthly chart, it becomes evident that the bollinger bands are definitely pinching, a further indicator of a future major move to be expected in the stock (hopefully upward.. ;0)
Monthly chart
As for DNDN.. I also, regretfully, was forced to sell that stock at a loss, and even now, with the recent news that FINALLY Congress is pushing for an investigation into the FDA decision on Provenge, the stock is trading below where I sold it at. All of that support that had been built into the stock over the past 6 months has now turned into resistance and it's going to require substantial news to overcome it.
Thus, under $8/share, DNDN is a very speculative trading vehicle.. But as I type this, I see the stock is trading at $7.70 on heavy volume (short covering, I suspect.. ;0)
The Scrutinizer
Subscribe to:
Posts (Atom)